Why Tracing
After getting Grafana, Mimir, Loki, and Alloy running on my servers, I had metrics and logs covered - but I was still missing the third pillar of observability: traces. When a slow request came in, I could see the spike in Mimir and the log lines in Loki, but I couldn't easily tell which part of the request was slow.
Adding Grafana Tempo was the natural next step. It completes the full LGTM stack (Loki, Grafana, Tempo, Mimir) and - combined with OpenTelemetry - gives me end-to-end traces correlated directly with logs.
Installing Tempo on the Monitoring Server
I followed the same pattern as the rest of the stack: a Docker container on the monitoring server with a named volume.
1. Create the directories and set permissions:
sudo mkdir -p /srv/tempo/{config,data}
sudo chown -R 10001:10001 /srv/tempo
docker volume create tempo-data
We use 10001 as the UID for the same reason as with Mimir and Loki - it's the default user inside Grafana Labs containers.
2. Create the Tempo config at /srv/tempo/config/tempo.yaml:
stream_over_http_enabled: true

server:
  http_listen_port: 3200
  grpc_listen_port: 9095
  log_level: warn

distributor:
  receivers:
    otlp:
      protocols:
        grpc:
          endpoint: 0.0.0.0:4317
        http:
          endpoint: 0.0.0.0:4318

ingester:
  max_block_duration: 5m

storage:
  trace:
    backend: local
    local:
      path: /var/tempo/blocks
    wal:
      path: /var/tempo/wal

metrics_generator:
  registry:
    external_labels:
      source: tempo
  storage:
    path: /var/tempo/generator/wal
    remote_write:
      - url: https://mimir.example.com/api/v1/push
        send_exemplars: true
        basic_auth:
          username: username
          password: password

overrides:
  defaults:
    metrics_generator:
      processors: [service-graphs, span-metrics]
    ingestion:
      max_traces_per_user: 0
    compaction:
      block_retention: 168h   # 7 days
The metrics_generator section is what makes Tempo really powerful - it automatically generates RED metrics (request rate, error rate, duration) from your traces and pushes them into Mimir, so you get Prometheus-style metrics without any extra instrumentation.
3. Start the container:
docker run -d \
  --name tempo \
  --restart unless-stopped \
  -p 3200:3200 \
  -p 4317:4317 \
  -p 4318:4318 \
  -v /srv/tempo/config/tempo.yaml:/etc/tempo/tempo.yaml:ro \
  -v tempo-data:/var/tempo \
  grafana/tempo:2.10.4 \
  -config.file=/etc/tempo/tempo.yaml
I'm pinning to a specific version here because at the time of writing, Grafana was actively changing the config structure and the latest image had breaking changes. Worth checking the release notes before upgrading.
Verify it's running with: docker ps | grep tempo
Exposing Tempo via Nginx
Tempo needs two different entry points: an HTTPS endpoint for Grafana to query traces, and a gRPC port for Alloy to ship traces from the app server.
1. Set up basic authentication:
sudo htpasswd -c /etc/nginx/.htpasswd-tempo username
sudo chmod 640 /etc/nginx/.htpasswd-tempo
sudo chown root:www-data /etc/nginx/.htpasswd-tempo
2. Generate the SSL certificate:
sudo certbot certonly --webroot -w /var/www/letsencrypt -d tempo.example.com
3. Create the Nginx config at /etc/nginx/sites-available/tempo.conf:
# HTTP → HTTPS redirect
server {
  listen 80;
  server_name tempo.example.com;
  return 301 https://$host$request_uri;
}

# HTTPS: Grafana query traffic (HTTP/1.1 REST)
server {
  listen 443 ssl http2;
  server_name tempo.example.com;

  ssl_certificate     /etc/letsencrypt/live/tempo.example.com/fullchain.pem;
  ssl_certificate_key /etc/letsencrypt/live/tempo.example.com/privkey.pem;
  ssl_session_timeout 1d;
  ssl_session_cache shared:SSL:10m;
  ssl_protocols TLSv1.2 TLSv1.3;
  ssl_prefer_server_ciphers on;

  client_max_body_size 20m;

  auth_basic "Tempo";
  auth_basic_user_file /etc/nginx/.htpasswd-tempo;

  location / {
    proxy_pass http://127.0.0.1:3200;
    proxy_http_version 1.1;

    proxy_set_header Host              $host;
    proxy_set_header X-Real-IP         $remote_addr;
    proxy_set_header X-Forwarded-For   $proxy_add_x_forwarded_for;
    proxy_set_header X-Forwarded-Proto $scheme;

    proxy_read_timeout 300;
    proxy_connect_timeout 300;
    proxy_send_timeout 300;
  }
}

# gRPC port 4327: Alloy trace ingestion
server {
  listen 4327 ssl http2;
  server_name tempo.example.com;

  ssl_certificate     /etc/letsencrypt/live/tempo.example.com/fullchain.pem;
  ssl_certificate_key /etc/letsencrypt/live/tempo.example.com/privkey.pem;
  ssl_session_timeout 1d;
  ssl_session_cache shared:SSL:10m;
  ssl_protocols TLSv1.2 TLSv1.3;

  # IP allowlist - only your app servers should push traces
  allow YOUR_IP_ADDRESS;
  deny all;

  location / {
    grpc_pass grpc://127.0.0.1:4317;
    grpc_set_header Host $host;
    grpc_read_timeout 300s;
    grpc_send_timeout 300s;
  }
}
Port 4327 is just an arbitrary port I chose for the gRPC ingestion endpoint. Since I only have a small number of servers that push traces, I protect it with an IP allowlist rather than basic auth - gRPC and basic auth have some rough edges that are easier to avoid.
4. Enable the config:
sudo ln -s /etc/nginx/sites-available/tempo.conf /etc/nginx/sites-enabled/tempo.conf
sudo nginx -t && sudo systemctl reload nginx
Configuring Alloy on the Web Server
Alloy already runs on my app server from the previous setup. I just needed to add the tracing pipeline to its config.
1. Open /etc/alloy/config.alloy and add the following to the bottom:
// Tracing: receive OTLP from Laravel and forward to Tempo

otelcol.receiver.otlp "default" {
  grpc {
    endpoint = "127.0.0.1:4317"
  }
  http {
    endpoint = "127.0.0.1:4318"
  }

  output {
    traces  = [otelcol.exporter.otlp.tempo.input]
    metrics = [otelcol.exporter.prometheus.mimir.input]
    logs    = [otelcol.exporter.loki.default.input]
  }
}

otelcol.exporter.otlp "tempo" {
  client {
    endpoint = "tempo.example.com:4327"
    tls {
      insecure = false
    }
  }
}

otelcol.exporter.prometheus "mimir" {
  forward_to = [prometheus.remote_write.mimir.receiver]
}

otelcol.exporter.loki "default" {
  forward_to = [loki.write.default.receiver]
}
This sets up Alloy to receive OTLP data from the Laravel app on 127.0.0.1:4317/4318 and fan it out - traces go to Tempo, metrics to Mimir, and logs to Loki.
2. Restart Alloy:
sudo systemctl restart alloy
sudo systemctl status alloy
Laravel and PHP OpenTelemetry Setup
PHP doesn't have OpenTelemetry built in, so we need to install the extension and wire up a Laravel package.
1. Install the PHP OpenTelemetry extension:
sudo apt-get install php8.4-opentelemetry
This installs and enables the extension automatically. Adjust the version number to match your PHP installation.
2. Add a local .env override before running composer:
OTEL_SDK_DISABLED=true
Without this, the next composer require will throw an error on your local machine because there's no Tempo instance running locally.
3. Install the Laravel OpenTelemetry package:
composer require keepsuit/laravel-opentelemetry
4. Publish the config:
php artisan vendor:publish --provider="Keepsuit\LaravelOpenTelemetry\LaravelOpenTelemetryServiceProvider" --tag="opentelemetry-config"
This creates config/opentelemetry.php where you can fine-tune what gets instrumented.
5. Add the OTLP log channel to config/logging.php:
'channels' => [
    'stack' => [
        'driver' => 'stack',
        'channels' => ['daily', 'otlp'],
    ],

    'otlp' => [
        'driver' => 'monolog',
        'handler' => \Keepsuit\LaravelOpenTelemetry\Support\OpenTelemetryMonologHandler::class,
        'level' => 'debug',
    ],
],
This is what ties traces to logs - every log line gets the current trace ID attached, so you can jump from a log entry directly to the full trace in Grafana.
6. Add the production .env variables:
OTEL_SDK_DISABLED=false

OTEL_SERVICE_NAME=your-app-name

# Point to Alloy running locally on the app server
OTEL_EXPORTER_OTLP_ENDPOINT=http://127.0.0.1:4318
OTEL_EXPORTER_OTLP_PROTOCOL=http/protobuf

OTEL_PROPAGATORS=tracecontext,baggage

OTEL_TRACES_EXPORTER=otlp
OTEL_METRICS_EXPORTER=otlp
OTEL_LOGS_EXPORTER=otlp

# Include authenticated user ID on all traces and logs
OTEL_USER_CONTEXT=true

# Keep errors and slow traces, drop the rest
OTEL_TRACES_TAIL_SAMPLING_ENABLED=true
OTEL_TRACES_TAIL_SAMPLING_SLOW_TRACES_THRESHOLD_MS=2000
Tail sampling is worth enabling early - it keeps every errored trace and anything slower than 2 seconds, while dropping routine fast requests. This keeps storage usage reasonable without losing the traces you actually care about.
Adding Tempo as a Data Source in Grafana
- Go to Connections → Data Sources → Add new → Tempo
- Set the URL to
https://tempo.example.comand enable Basic Auth with your credentials - Under Trace to logs, select your Loki data source and add the tags
service.nameandhost.name- this is what powers the "jump to logs" button on a trace - Under Trace to metrics, select your Mimir data source
- Hit Save & Test
Dashboards
With everything connected, here's what I built in Grafana to keep an eye on things.
Slow Requests
This is the most immediately useful view - a table of every route that averages over 300ms, with a direct link to the full trace for each one.
- Data source: Tempo
- Visualization: Table
- Query:
{ name =~ "GET .*|POST .*|PUT .*|DELETE .*" } | avg(duration) > 300ms
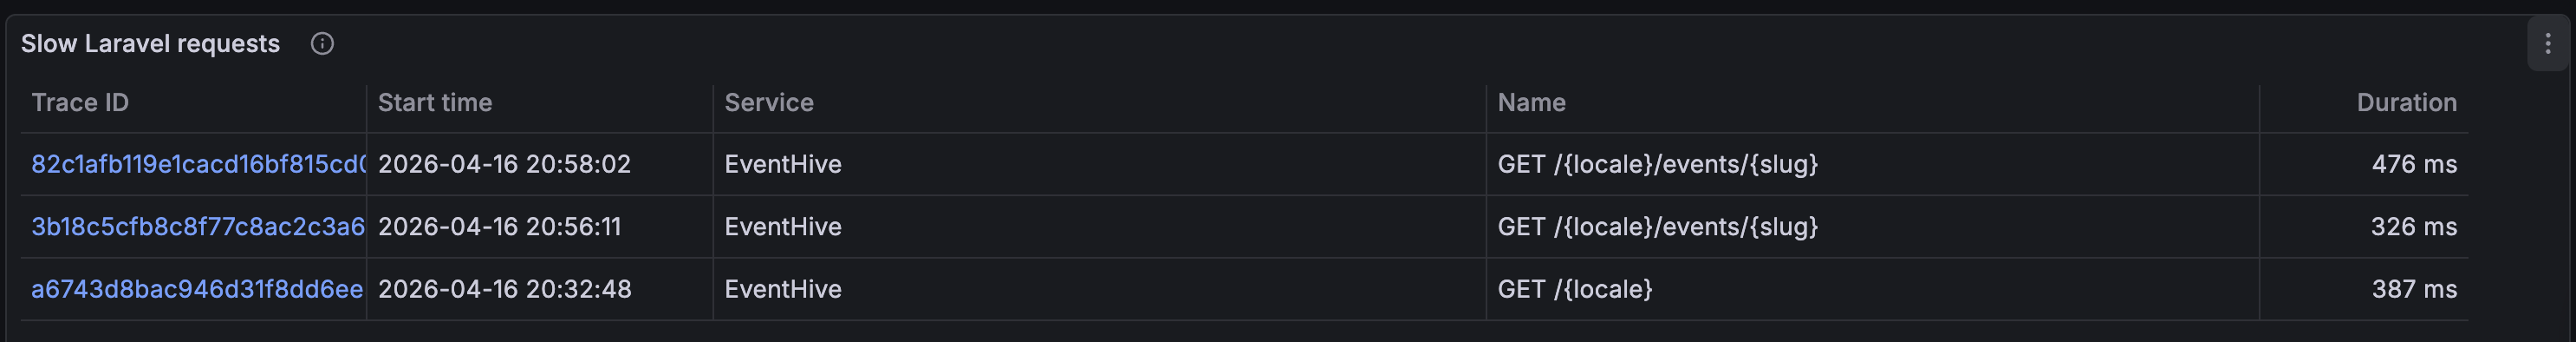
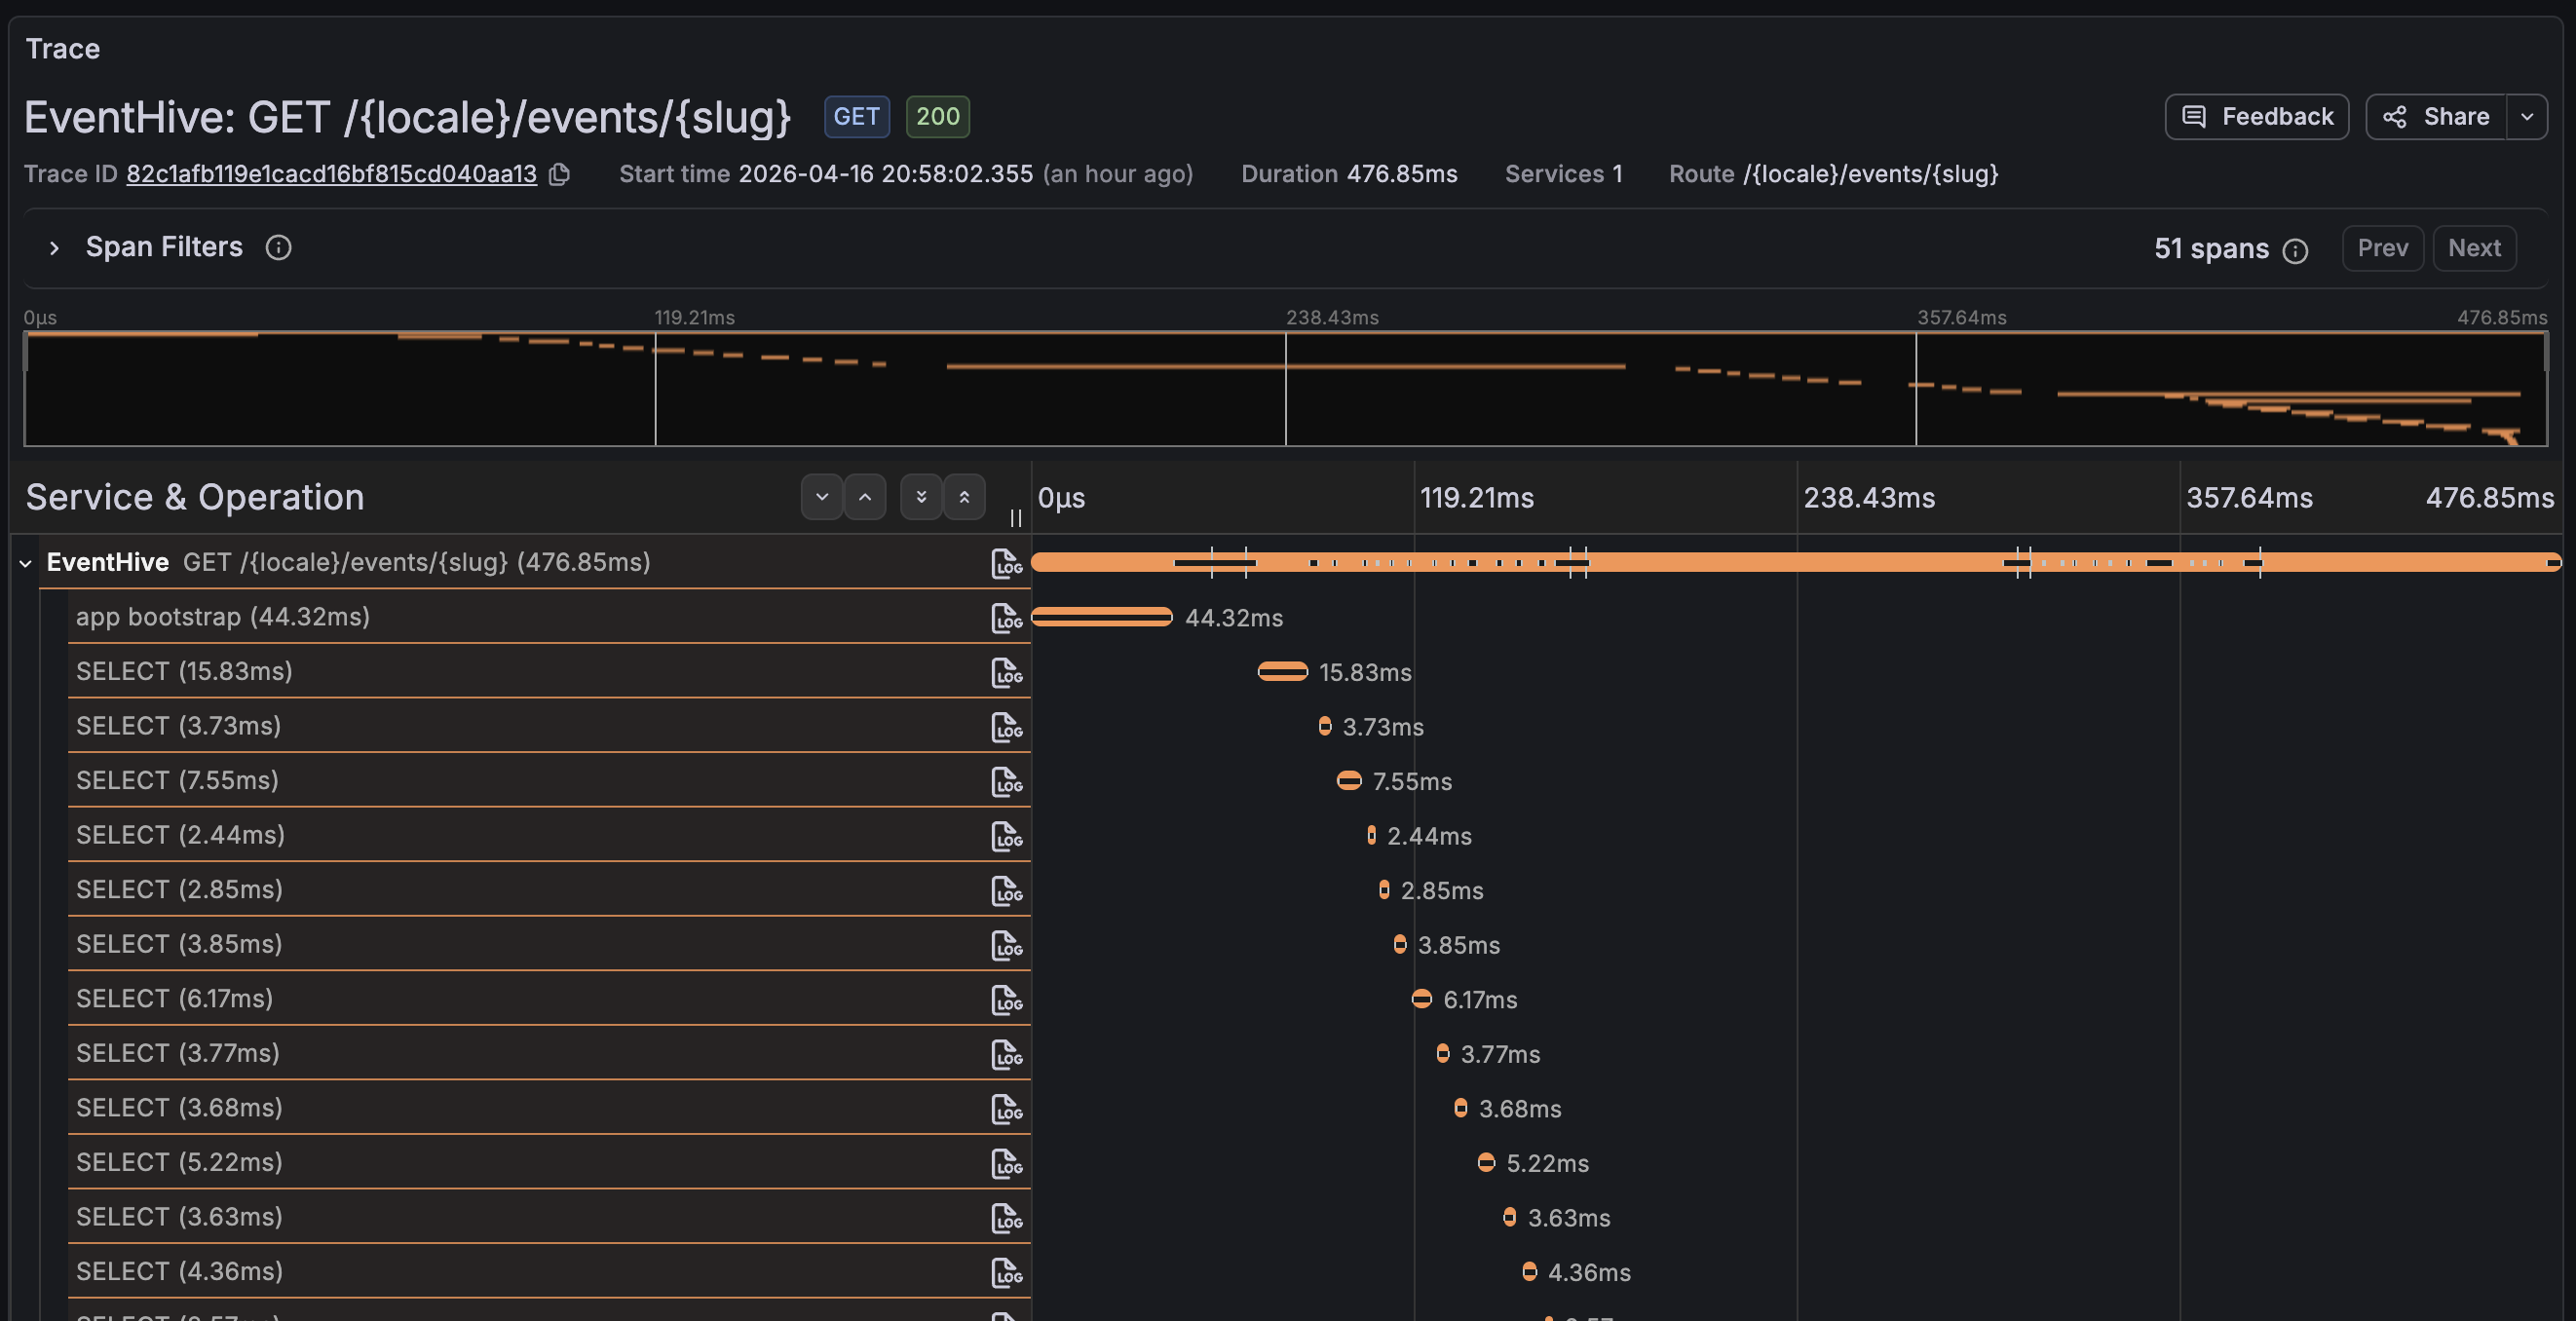
Clicking the trace ID opens the full span waterfall, which makes it immediately obvious whether the time is spent in a database query, an external HTTP call, or somewhere in the application logic.
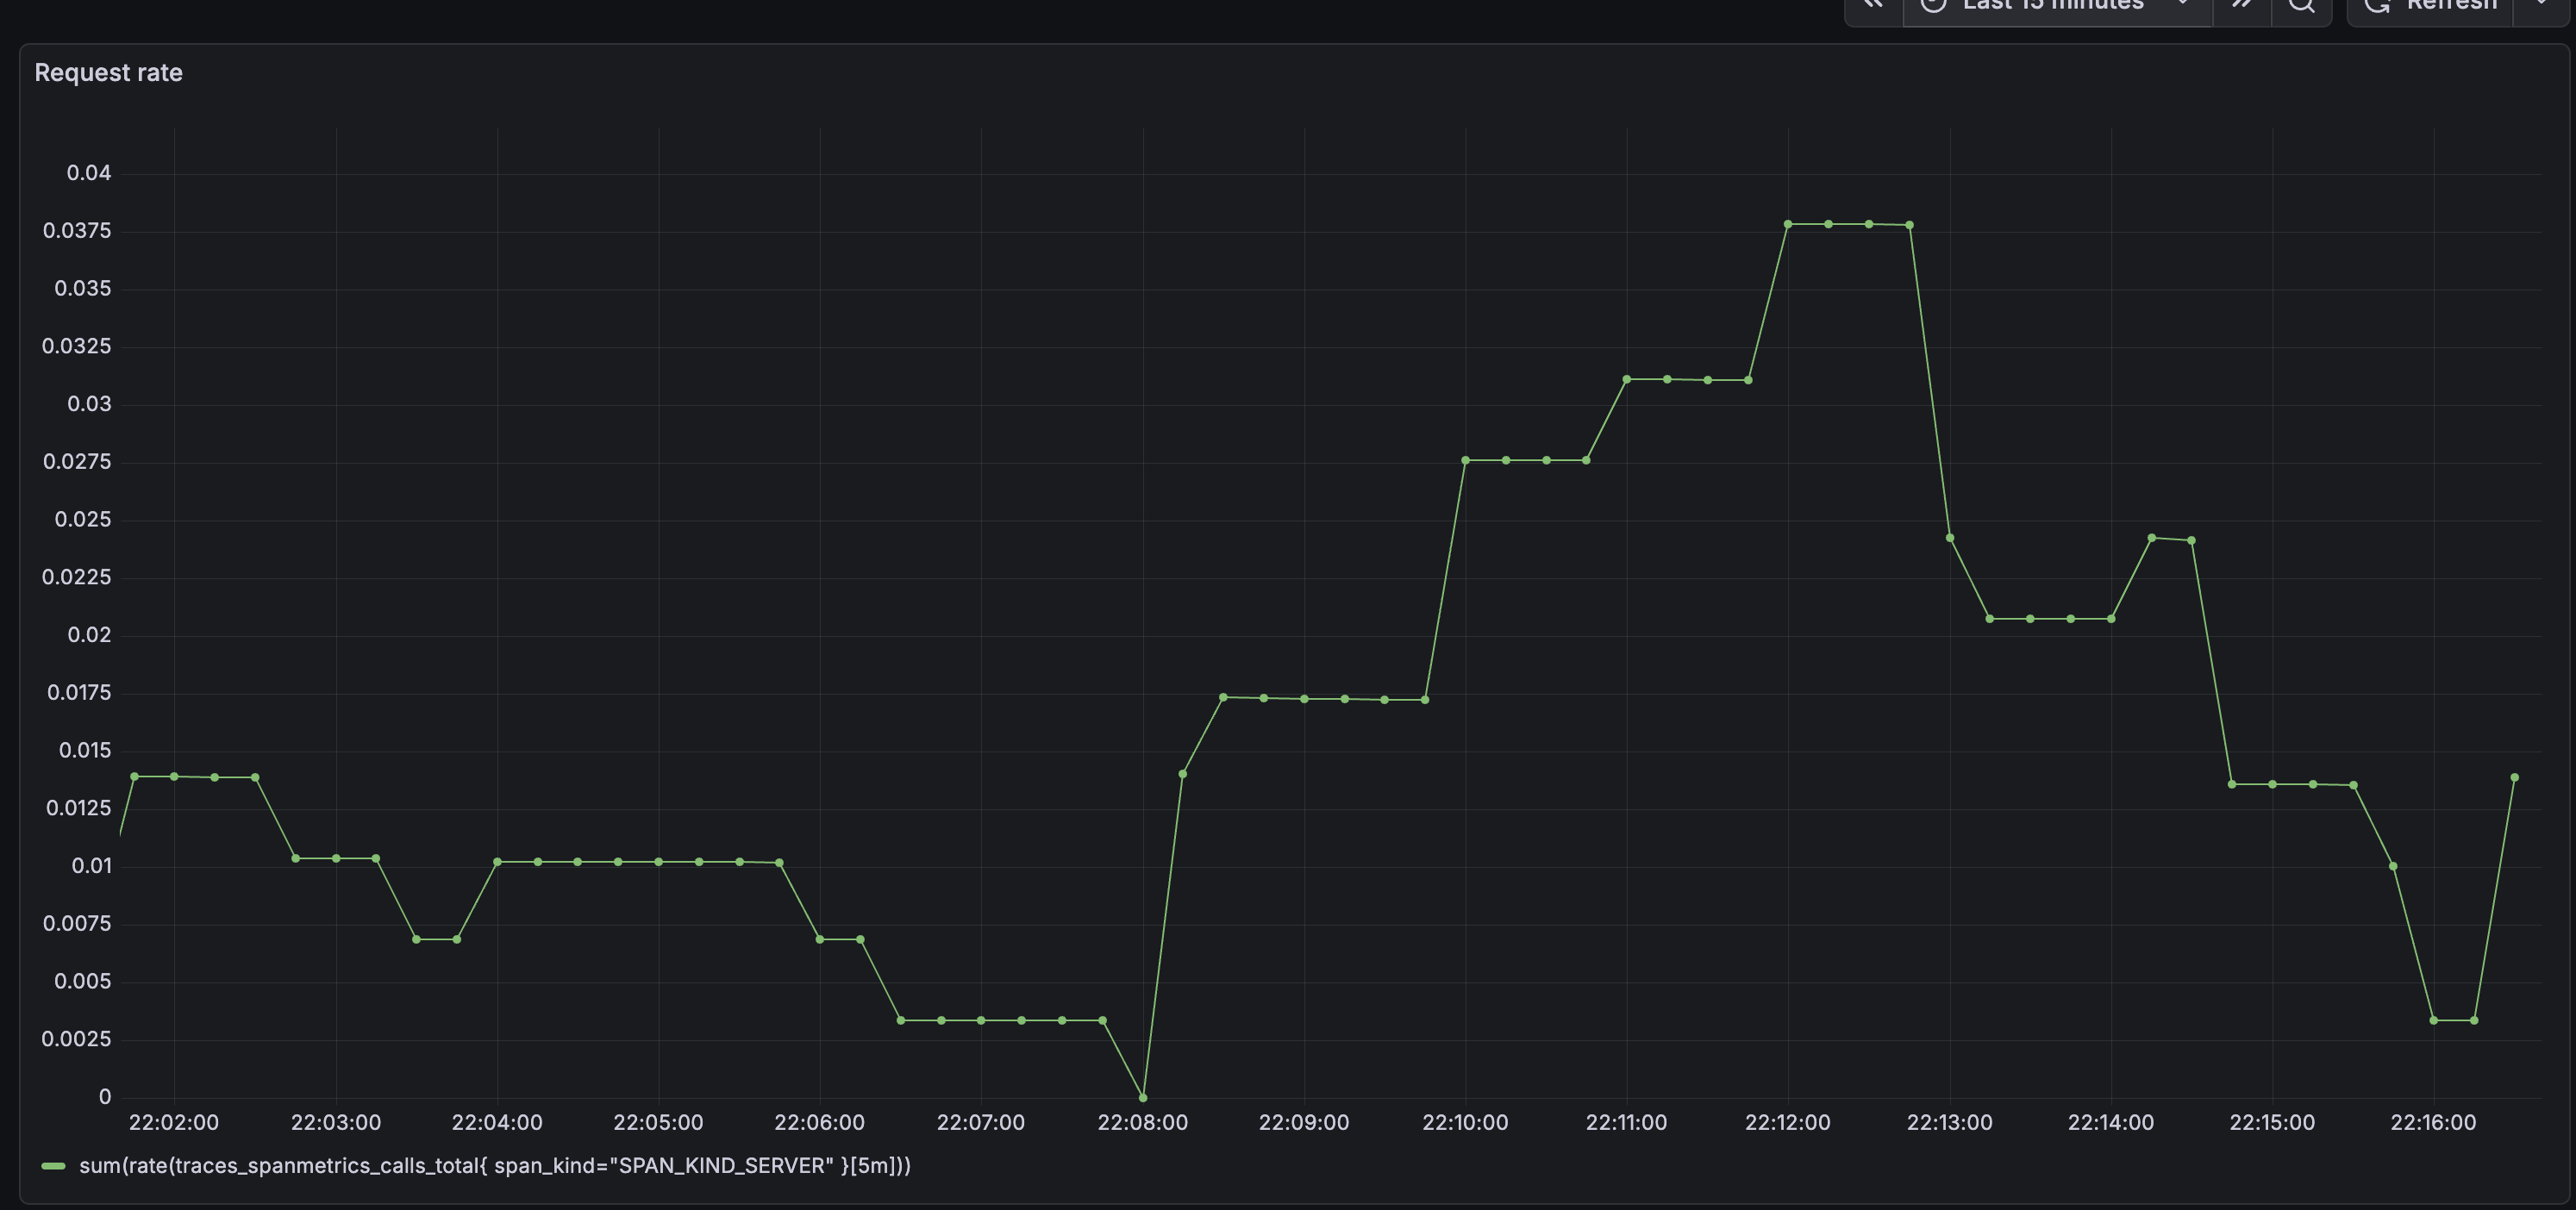
Request Rate
- Data source: Mimir
- Visualization: Time series
- Query:
sum(rate(traces_spanmetrics_calls_total{
  span_kind="SPAN_KIND_SERVER"
}[5m]))
traces_spanmetrics_calls_total is a counter metric automatically generated by Tempo's metrics generator. It tracks the total number of server-side spans, which lets you calculate request rate, error rate, and other RED metrics without any extra instrumentation in your app.
Error Rate
- Data source: Mimir
- Visualization: Time series
- Query:
sum(rate(traces_spanmetrics_calls_total{
  status_code="STATUS_CODE_ERROR",
  span_kind="SPAN_KIND_SERVER"
}[5m]))
/
sum(rate(traces_spanmetrics_calls_total{
  span_kind="SPAN_KIND_SERVER"
}[5m]))
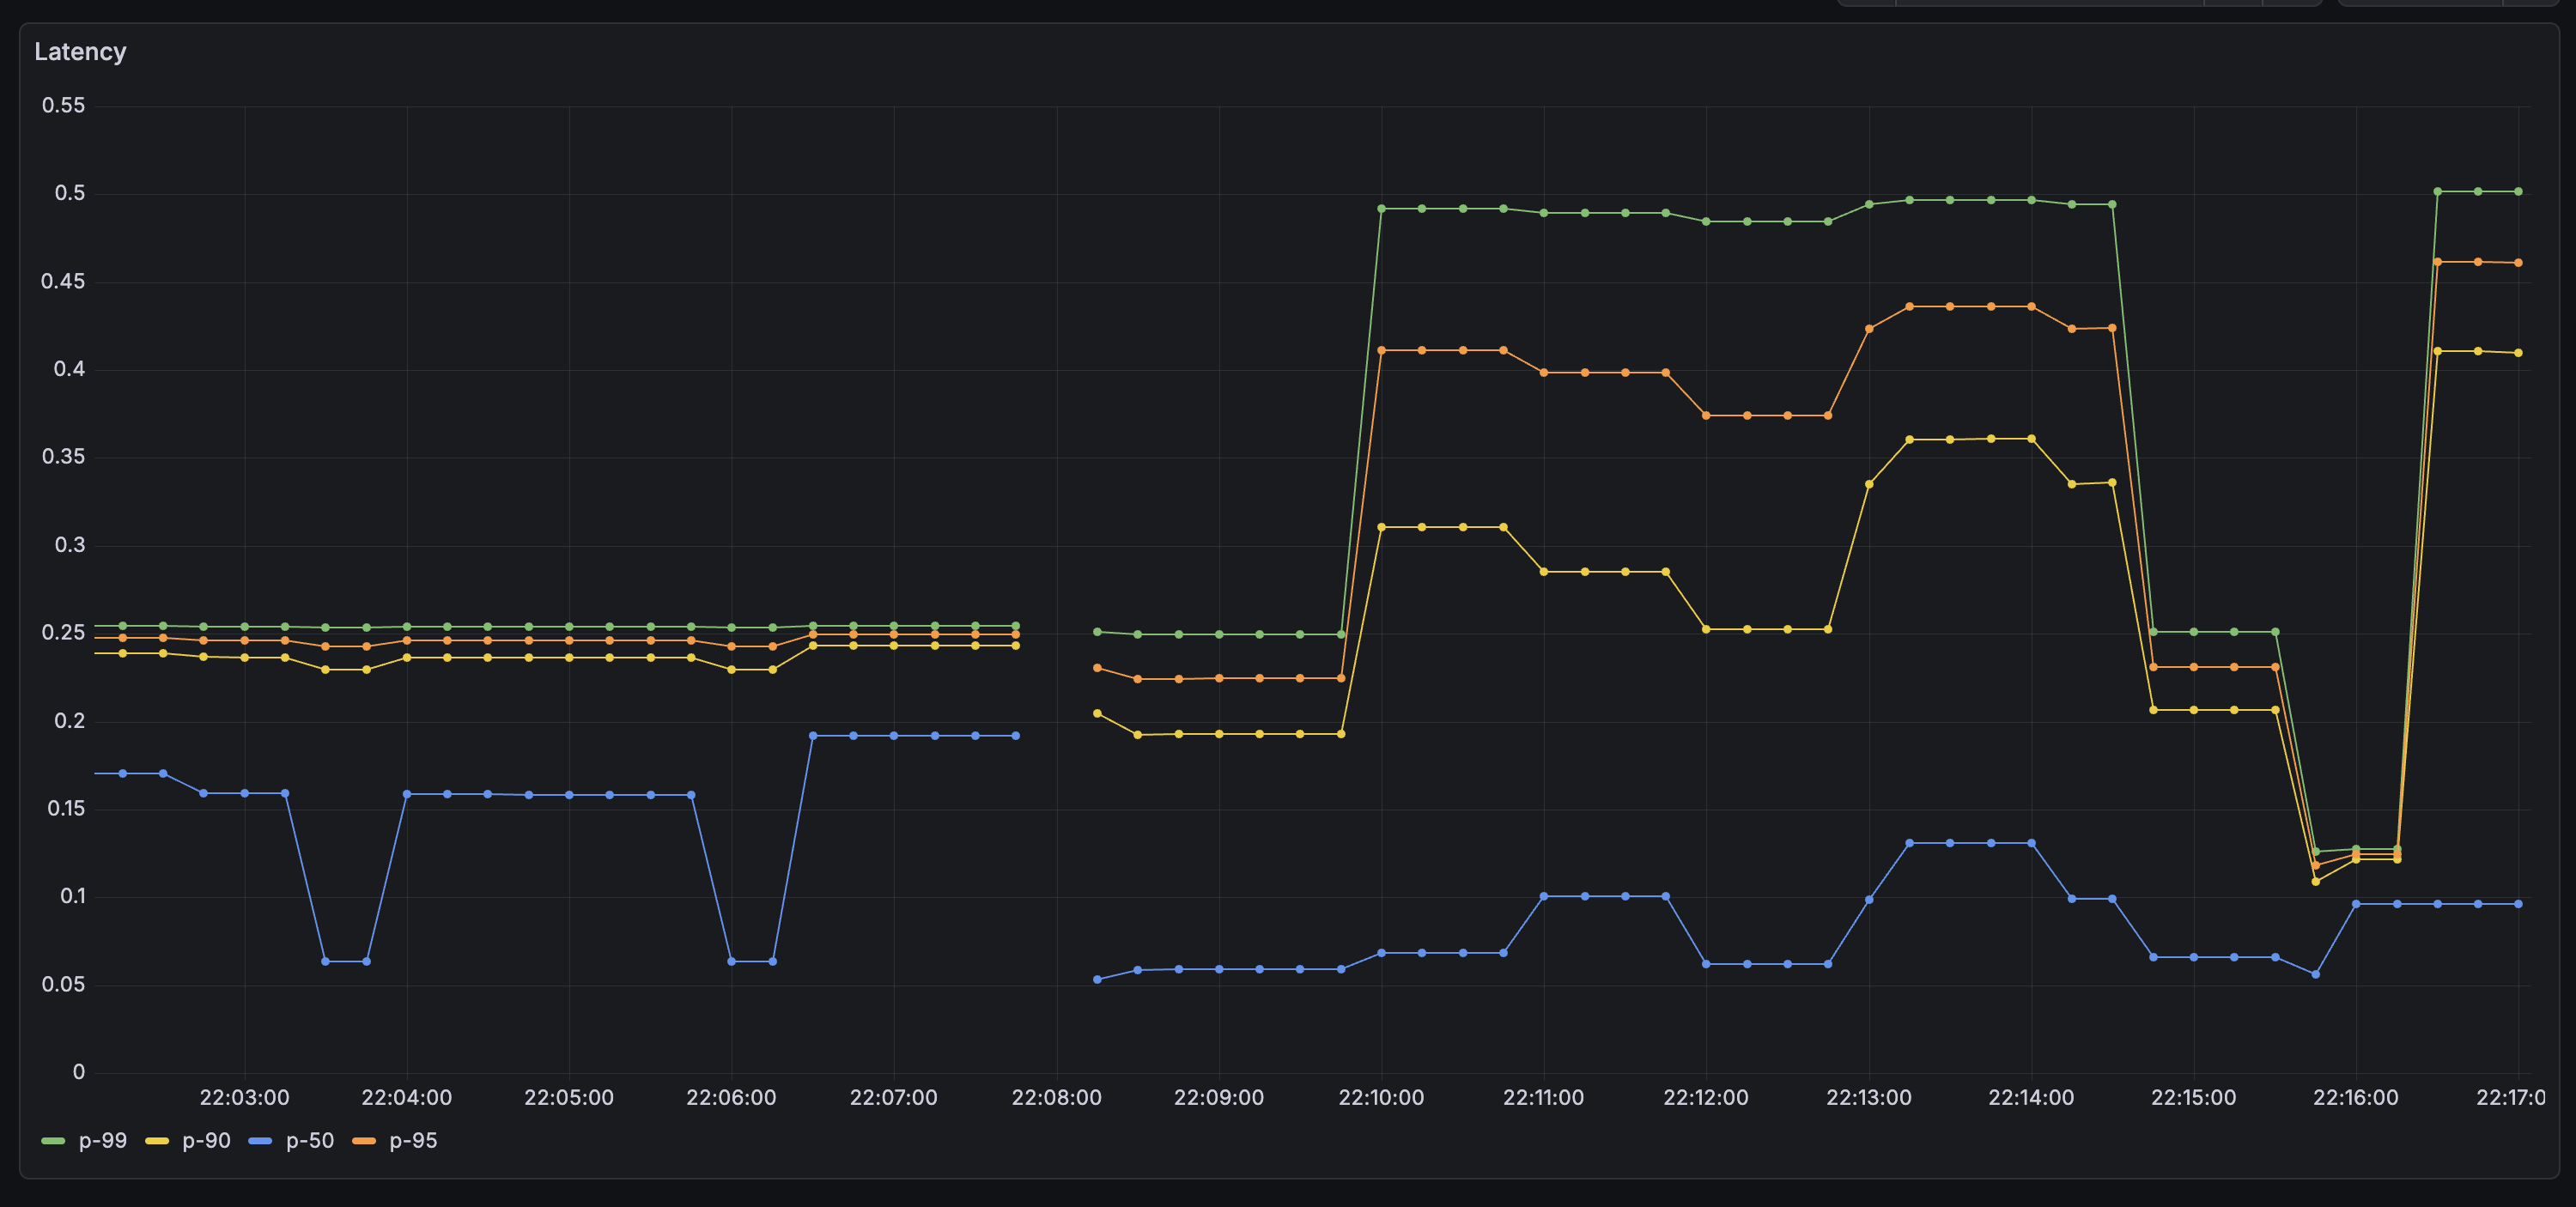
Latency Percentiles
I added four queries on one panel - P50, P90, P95, and P99 - to get a clear picture of the tail latency.
- Data source: Mimir
- Visualization: Time series
- Query (replace
0.95with0.99,0.90, and0.50for the other series):
histogram_quantile(
  0.95,
  sum by (le) (
    rate(traces_spanmetrics_latency_bucket{
      span_kind="SPAN_KIND_SERVER"
    }[5m])
  )
)
P99 is the one to watch for intermittent issues - it's the 1% of requests that took the longest, and it often surfaces problems that only appear under specific conditions or for specific users.
Wrapping Up
With Tempo in place, the LGTM stack is complete. Metrics, logs, and traces are all flowing into Grafana and cross-linked - I can jump from a log line to its trace, or from a slow-request alert to the exact span that caused it. It took a bit of wiring, but everything in this stack plays nicely together once it's configured. The logical next step is setting up alerts so Grafana notifies you when something goes wrong, rather than waiting for you to notice.
Thank you for reading, and let's connect!