Why Alerting
With the full LGTM stack running - metrics in Mimir, logs in Loki, traces in Tempo - I had all the data I needed. But data is useless if I'm not watching dashboards around the clock. I needed Grafana to come to me when something goes wrong, not the other way around.
Grafana's built-in alerting covers two cases I care about:
- Metric alerts (from Mimir) - something measurable crossed a threshold: CPU above 85%, error rate spiking, MySQL connections maxed out
- Log alerts (from Loki) - a specific pattern appeared in the logs: PHP fatal errors, "out of memory", a sudden spike in 500 responses
Before diving in, it helps to know how these three pieces fit together:
- Alert rules - the conditions that trigger alerts, written in PromQL or LogQL
- Contact points - where notifications go (email, Slack, Discord, PagerDuty, etc.)
- Notification policies - which alerts route to which contact points
Setting Up a Contact Point
I started with Discord since it's the quickest to wire up. Go to Alerting → Contact points - there's already a default one there.
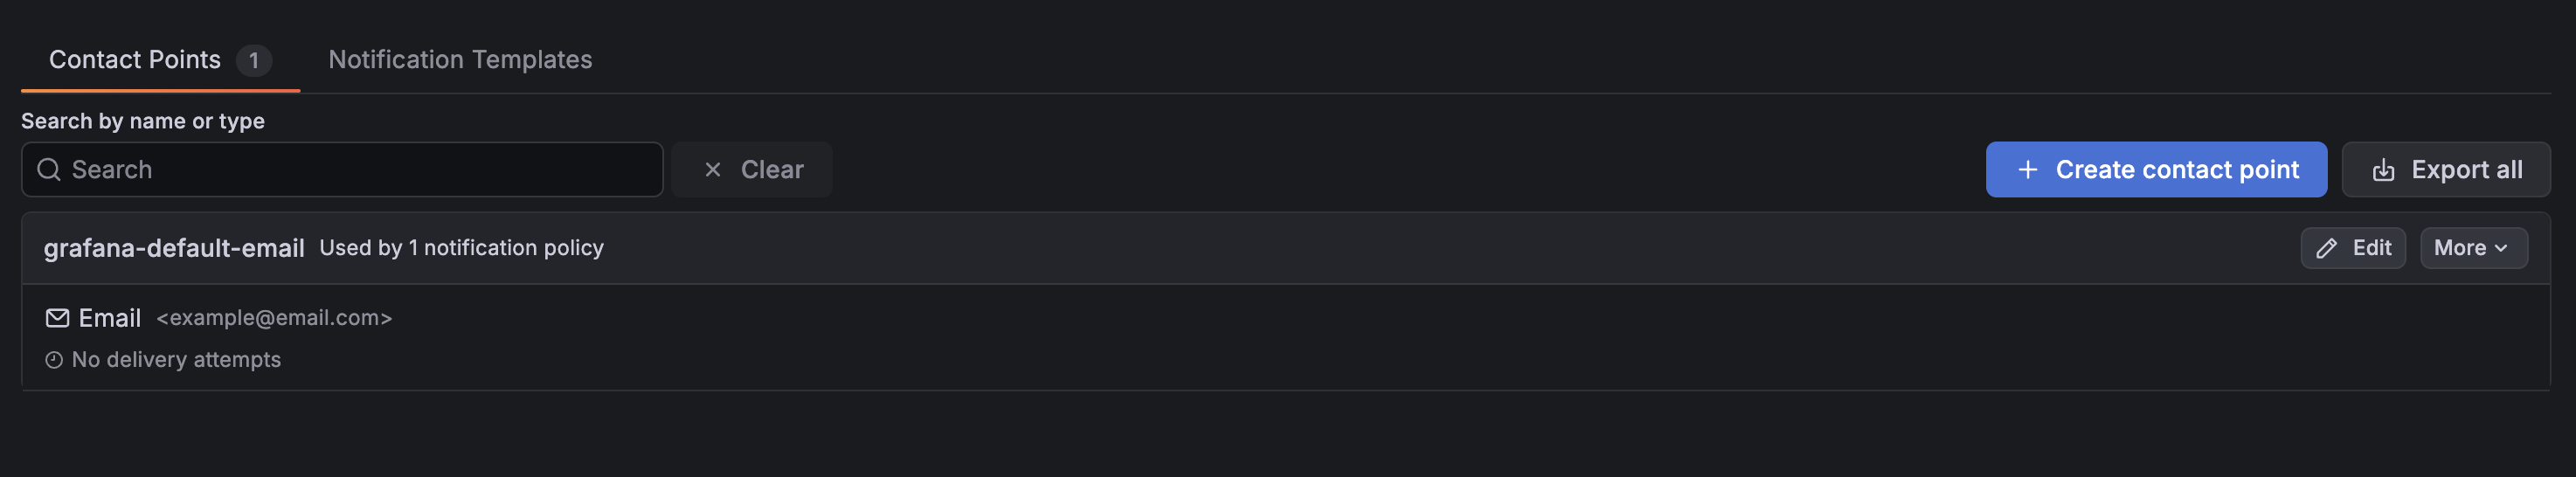
Click Add contact point, then change the Integration field from Email to Discord.
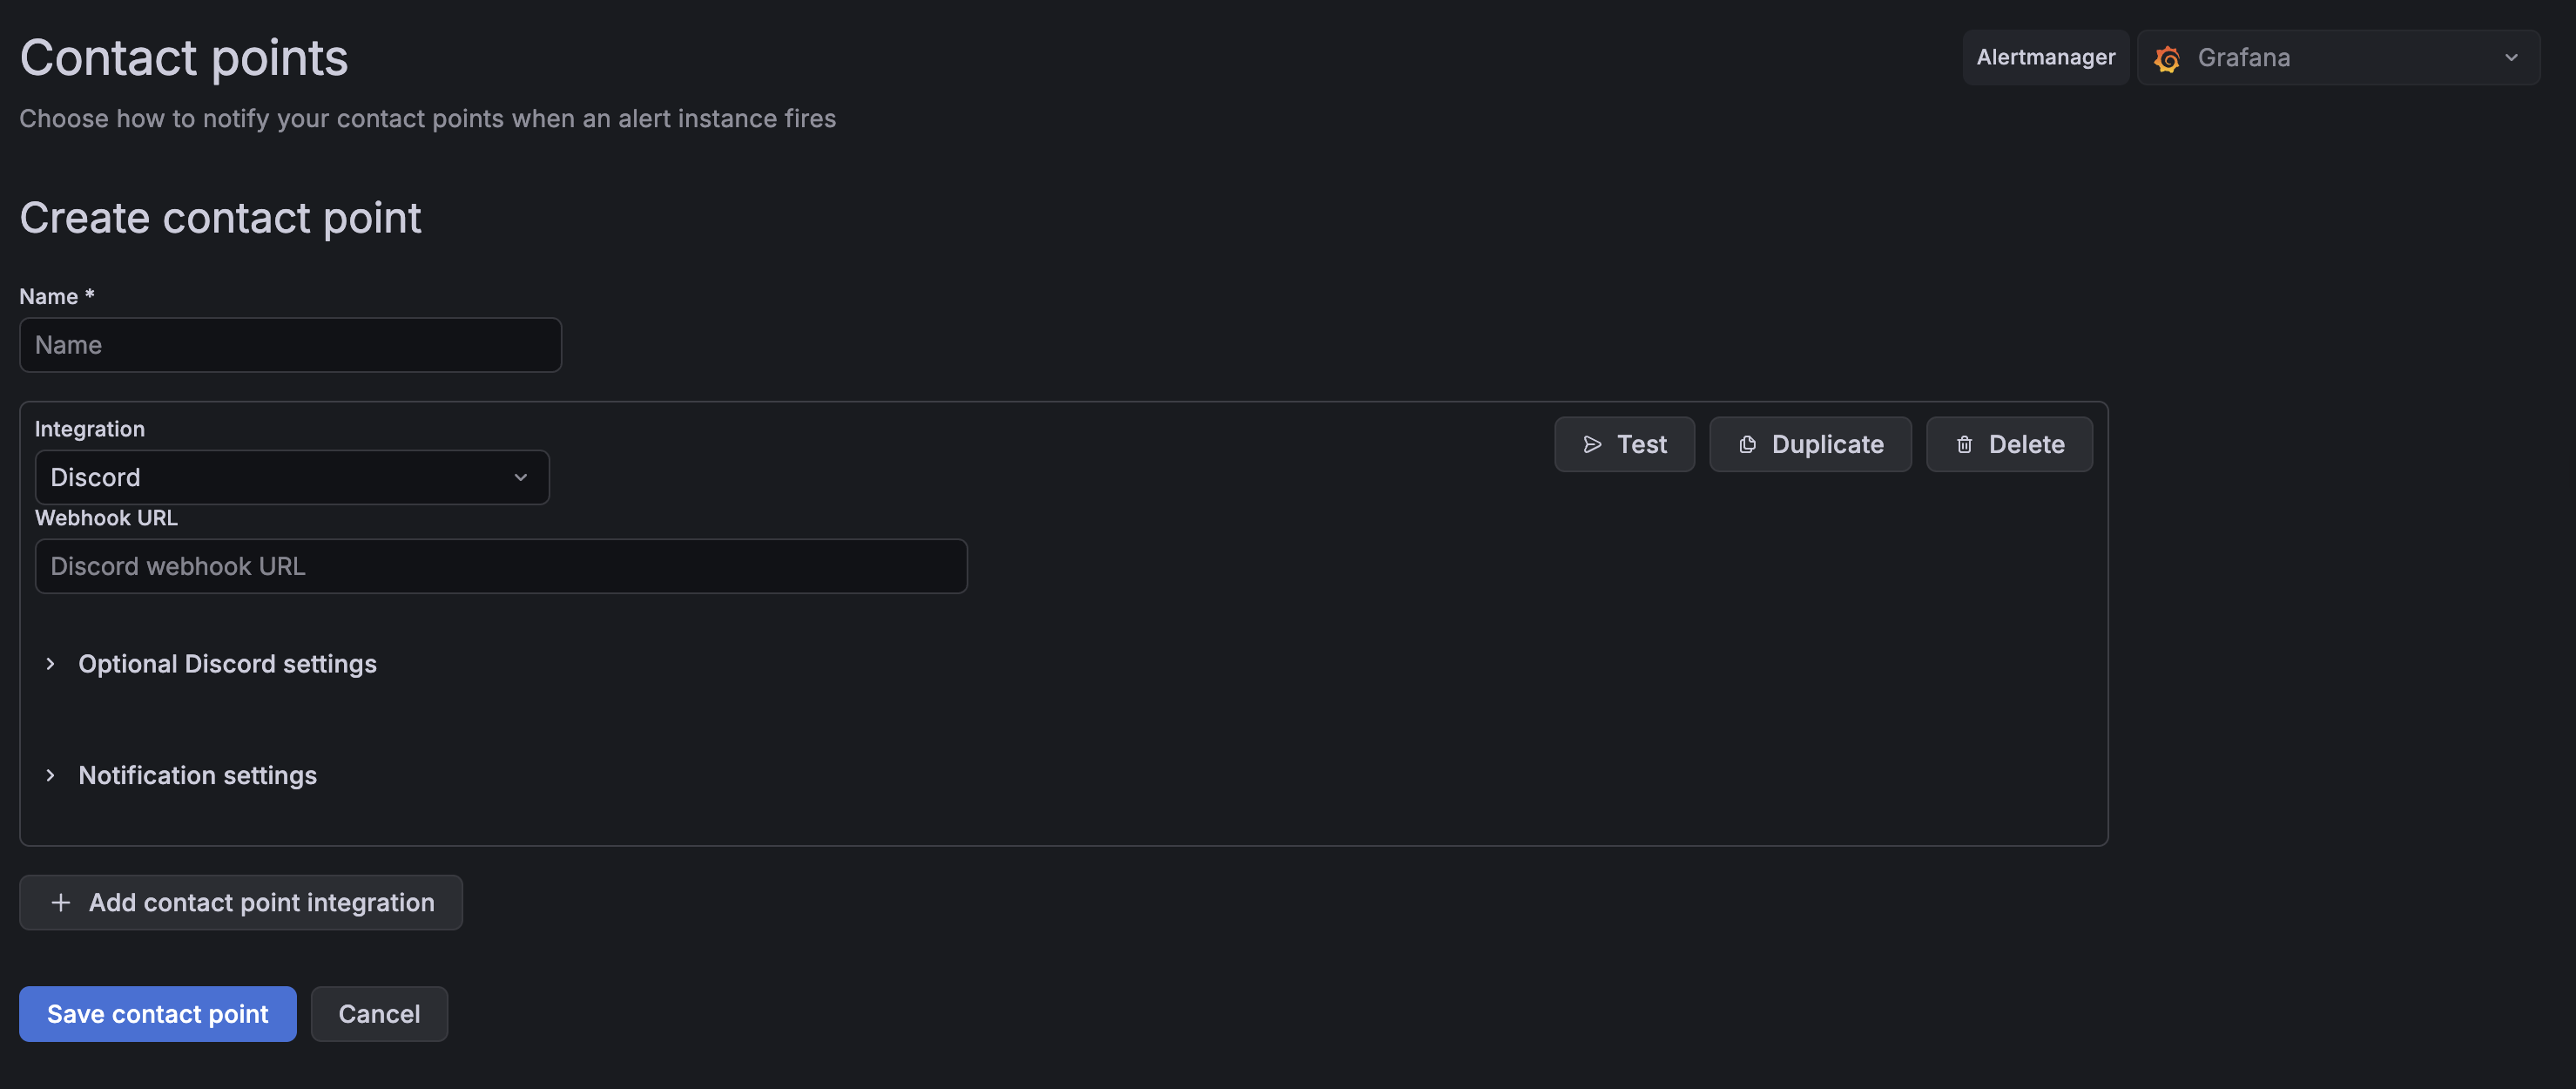
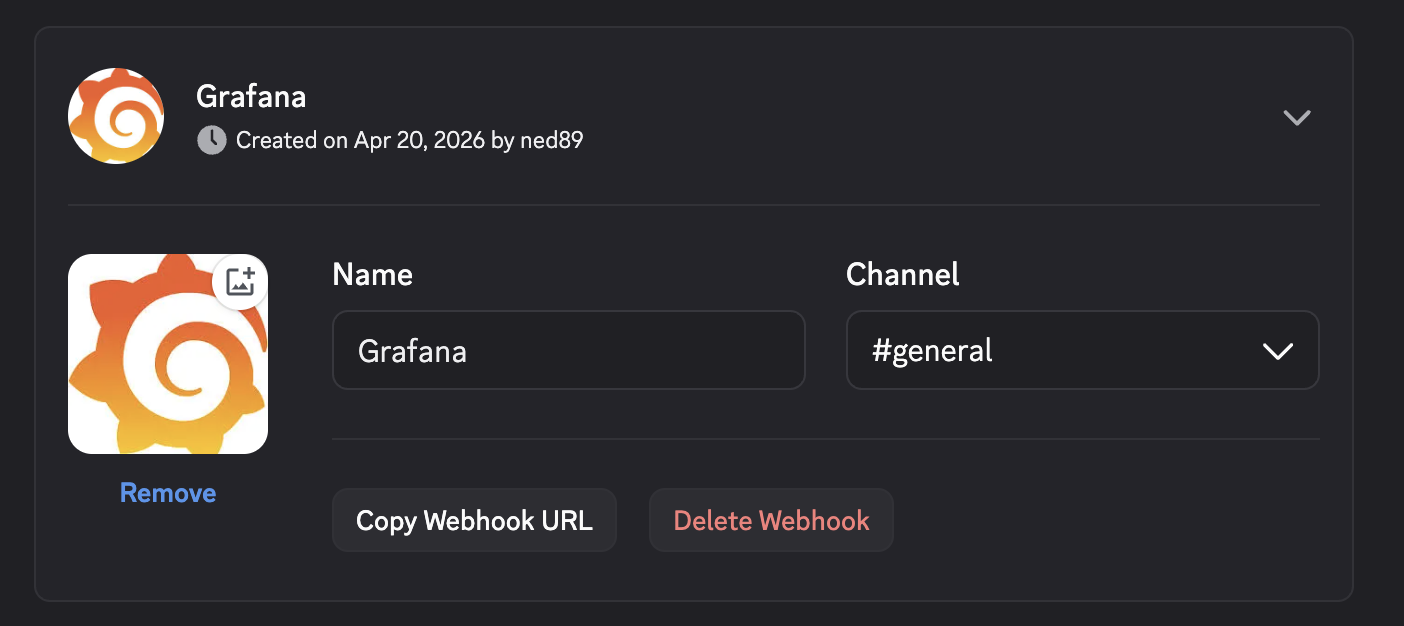
To get the webhook URL, open your Discord server and go to Server Settings → Integrations → Webhooks → New Webhook. Name it, pick a channel, and hit Copy Webhook URL. Paste that into Grafana.
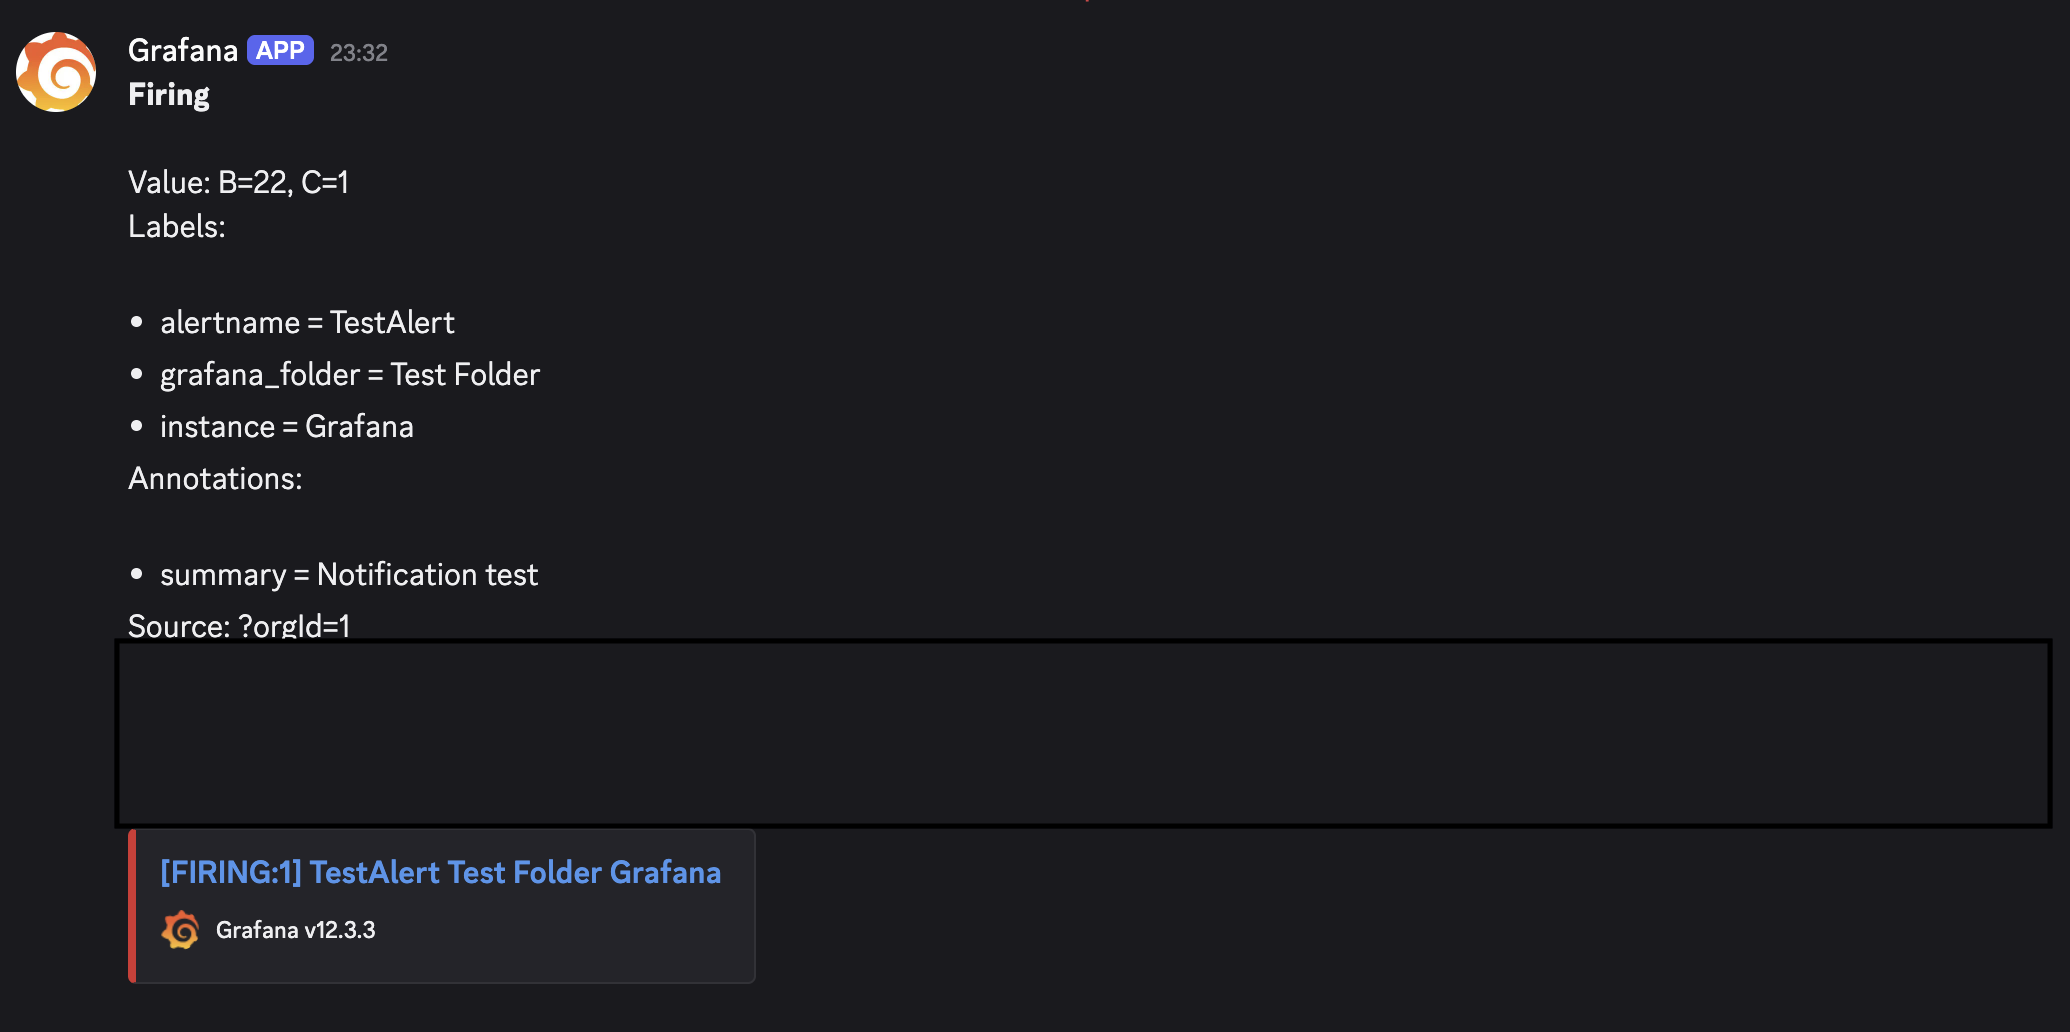
Hit Test to send a test notification before saving. You should see something like this arrive in your Discord channel:
CPU Usage Alert
Let's start with the most fundamental metric alert. Go to Alerting → Alert rules → New alert rule.
- Set the data source to Mimir
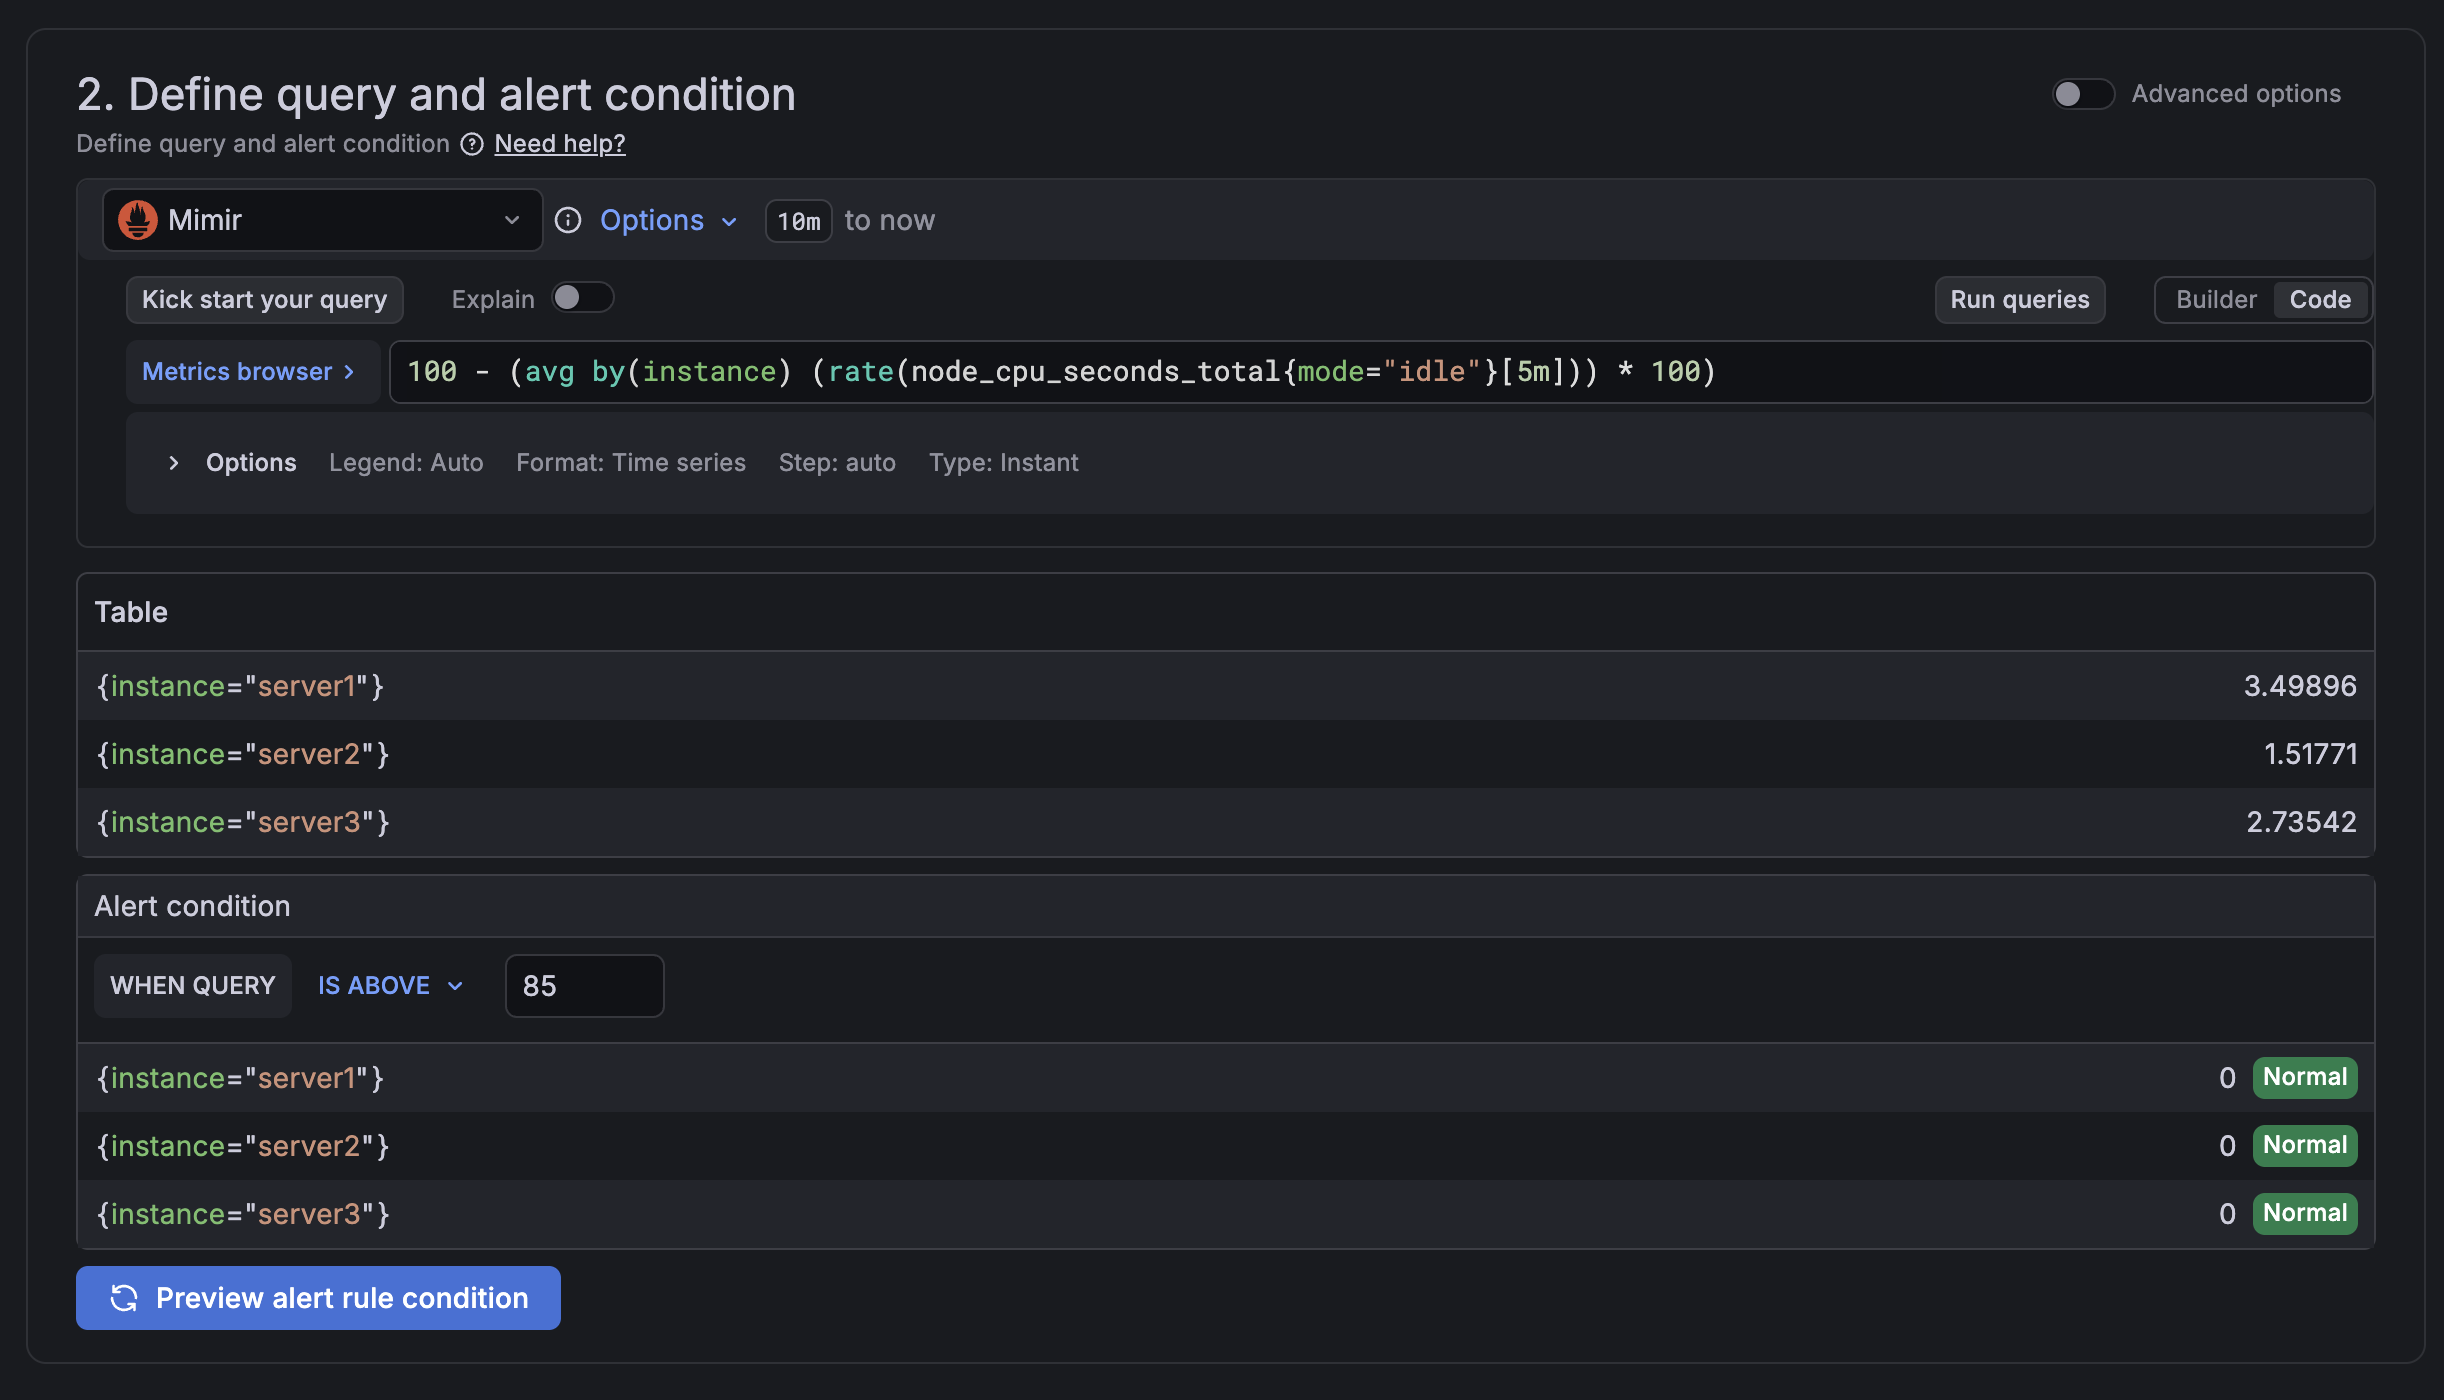
- Add the following query:
100 - (avg by(instance) (rate(node_cpu_seconds_total{mode="idle"}[5m])) * 100)
This calculates CPU usage across all monitored instances. Hit Run queries to verify you're getting real data back.
Under Alert condition, set the threshold to 85 - high enough to signal a real problem without triggering on brief spikes.
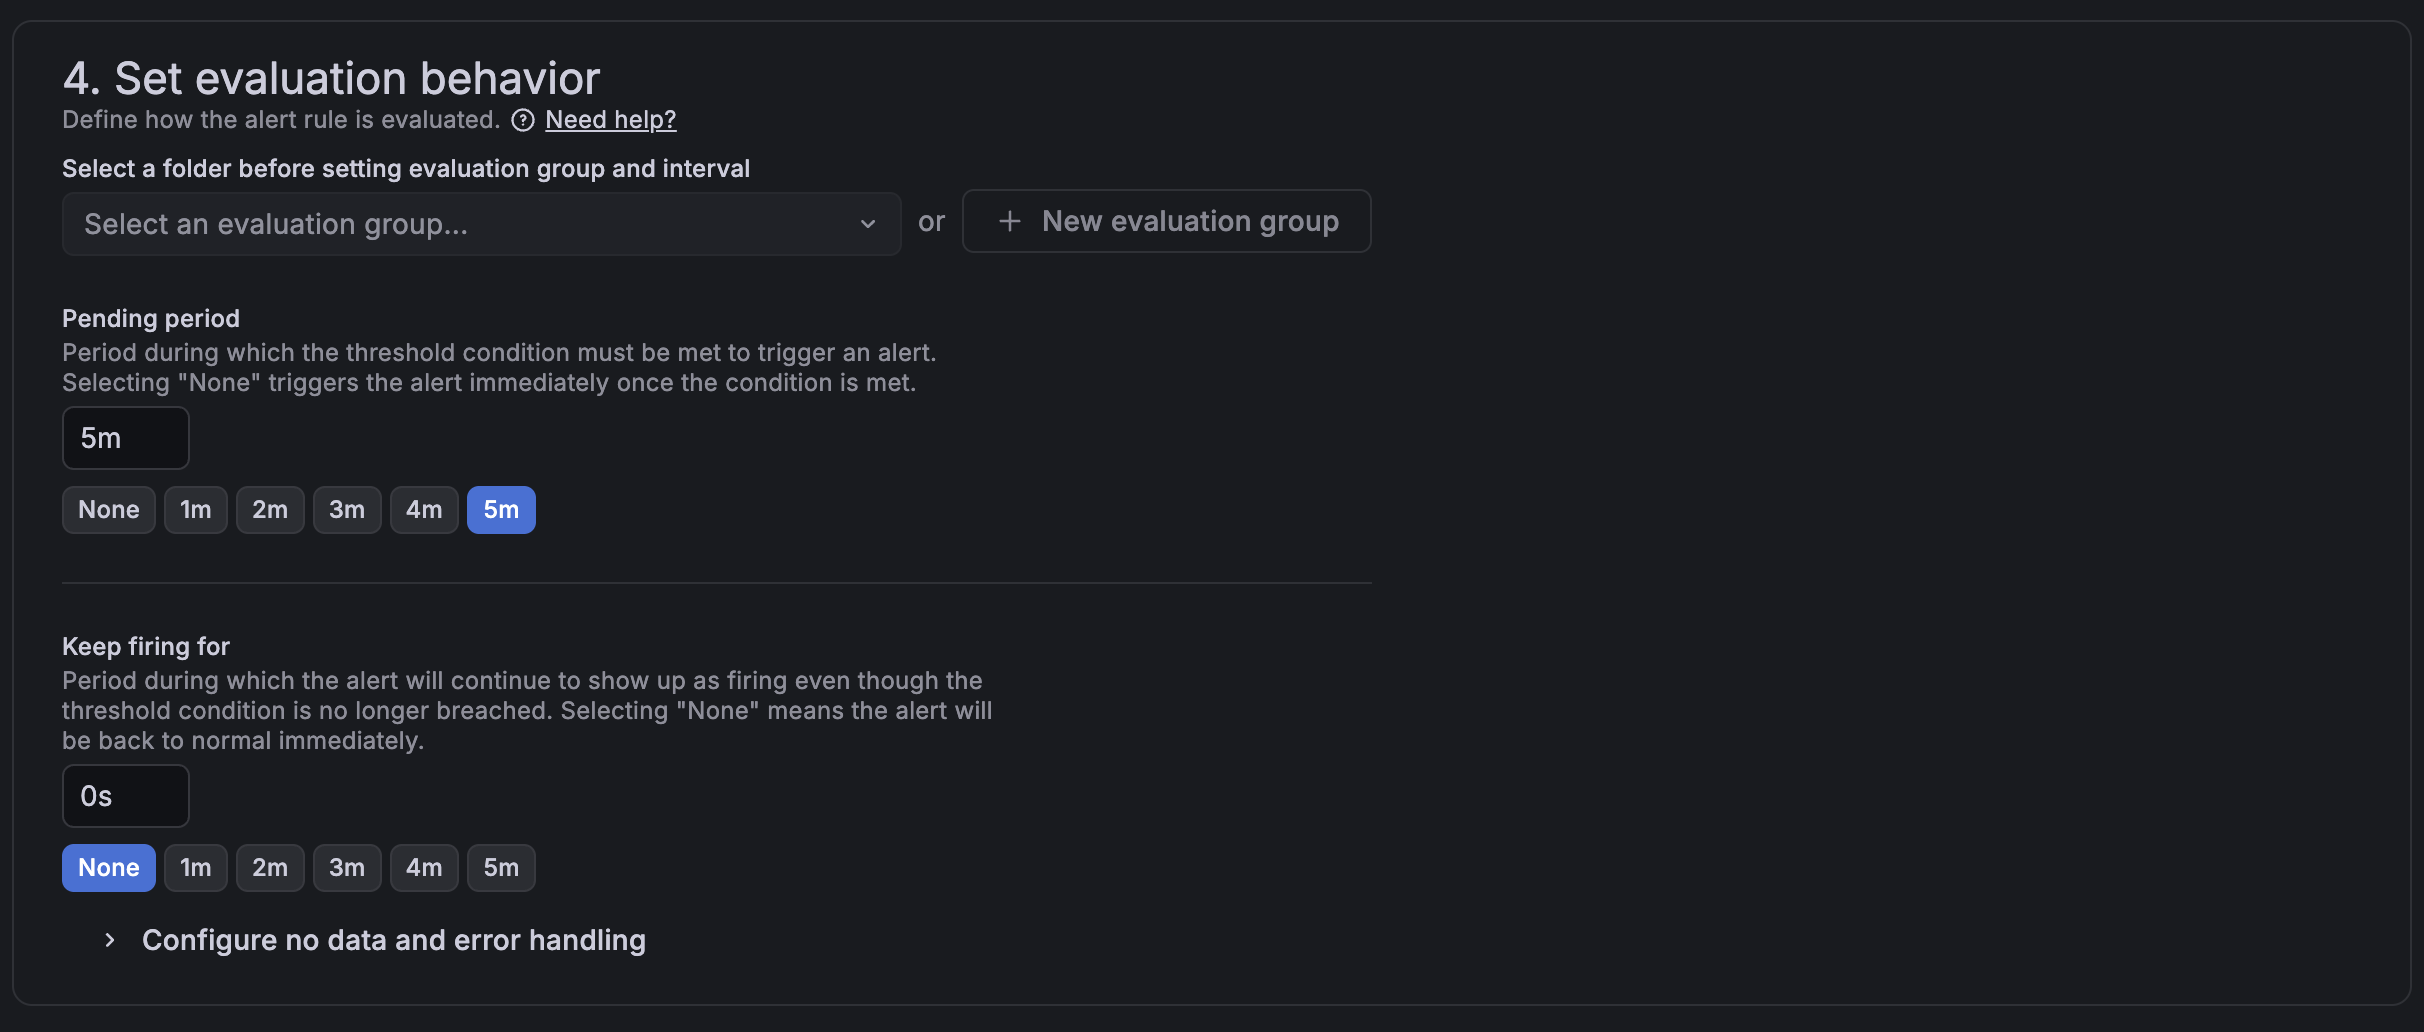
Under Set evaluation behavior, I set the pending period to 5 minutes. This means the condition has to be sustained for 5 minutes before the alert fires, which avoids false positives from momentary CPU bursts.
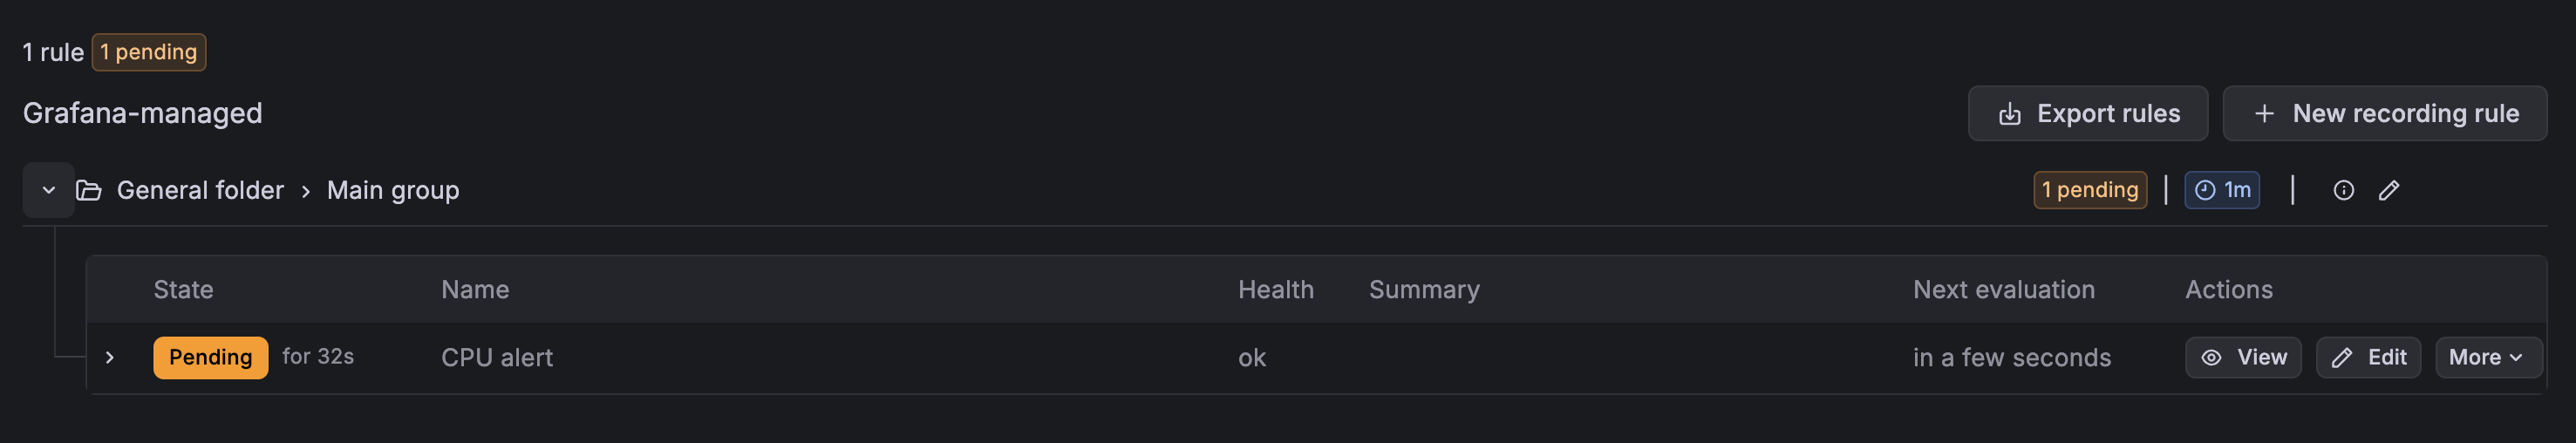
Select Discord as the contact point and save. After creating the rule, it will sit in Pending state for the evaluation period before transitioning to OK or Firing - that's normal.
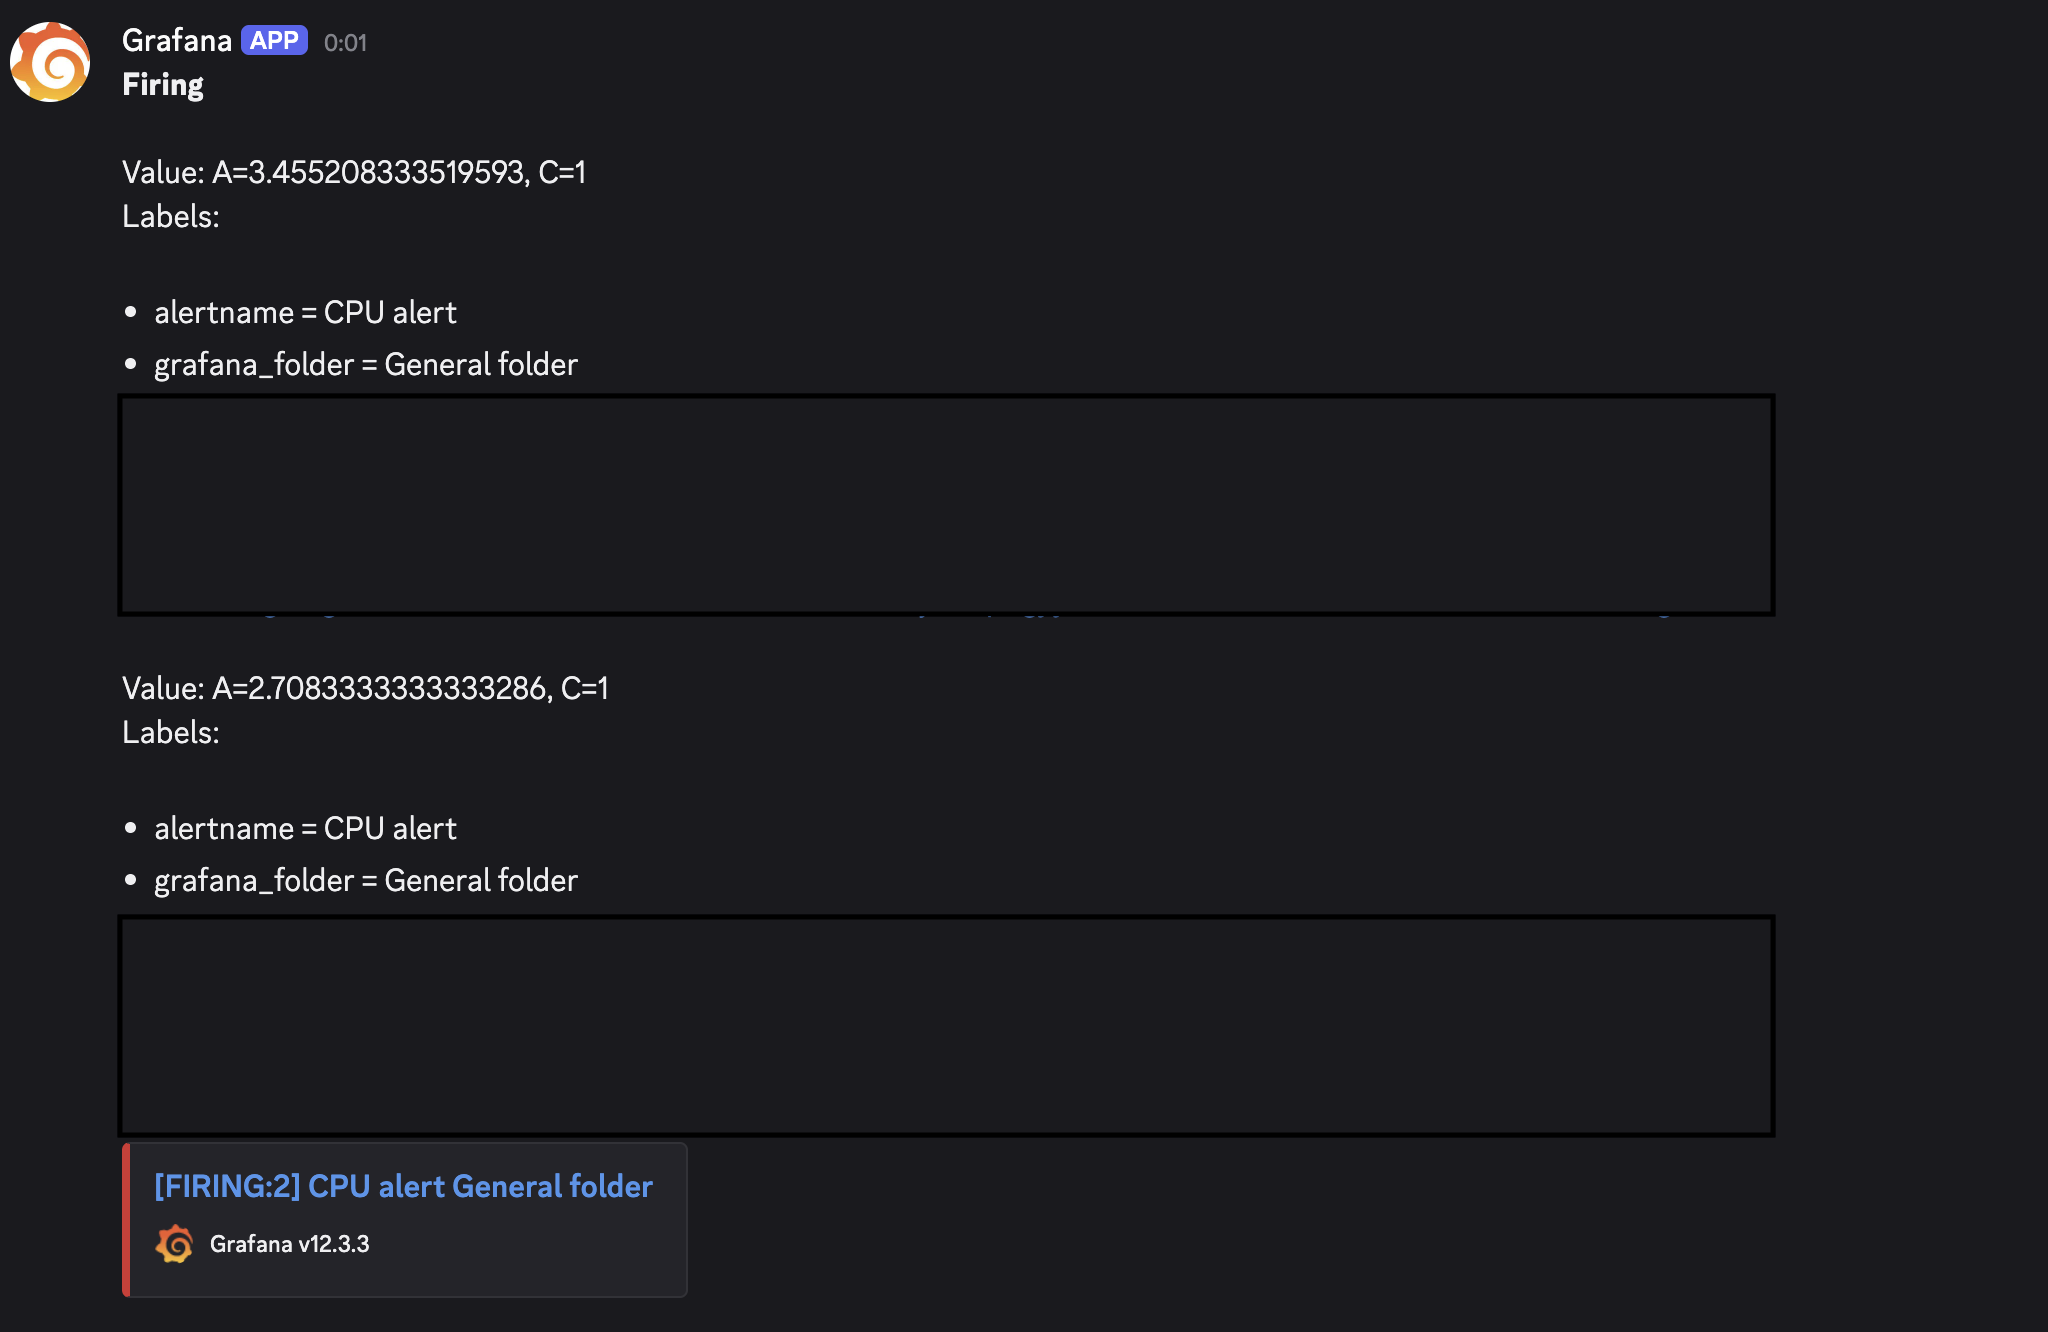
Here's a live notification from when I tested it by temporarily lowering the threshold:
MySQL Max Connections Alert
Since MySQL monitoring is already set up, we can put those metrics to work immediately. Create a new alert rule with this query:
(mysql_global_status_threads_connected * 100) / mysql_global_variables_max_connections
Set the alert condition to above 80 (percent) with a pending period of 1 minute. This gives you an early warning when your application is burning through connections - long before it starts throwing "too many connections" errors.
Log-Based Alert with Loki
For log alerts, the setup is similar but you switch the data source to Loki. This example counts log entries from a Laravel application over a 5-minute window:
count_over_time({filename="/var/www/your-app/storage/logs/laravel.json.log"}[5m])
Replace the path with your own log file. For production, set the threshold above 0 rather than treating any log as an alert - tune it to what's normal for your app traffic.
One important edge case: if your app is healthy and producing no logs, Grafana will return a No data status for this query. Without extra configuration, that can trigger a false alert. To handle it, scroll to section 4 of the rule editor - Set evaluation behavior - and open Configure no data and error handling. Set the dropdown to Normal. This tells Grafana that no logs means everything is fine.
Silencing Alerts During Maintenance
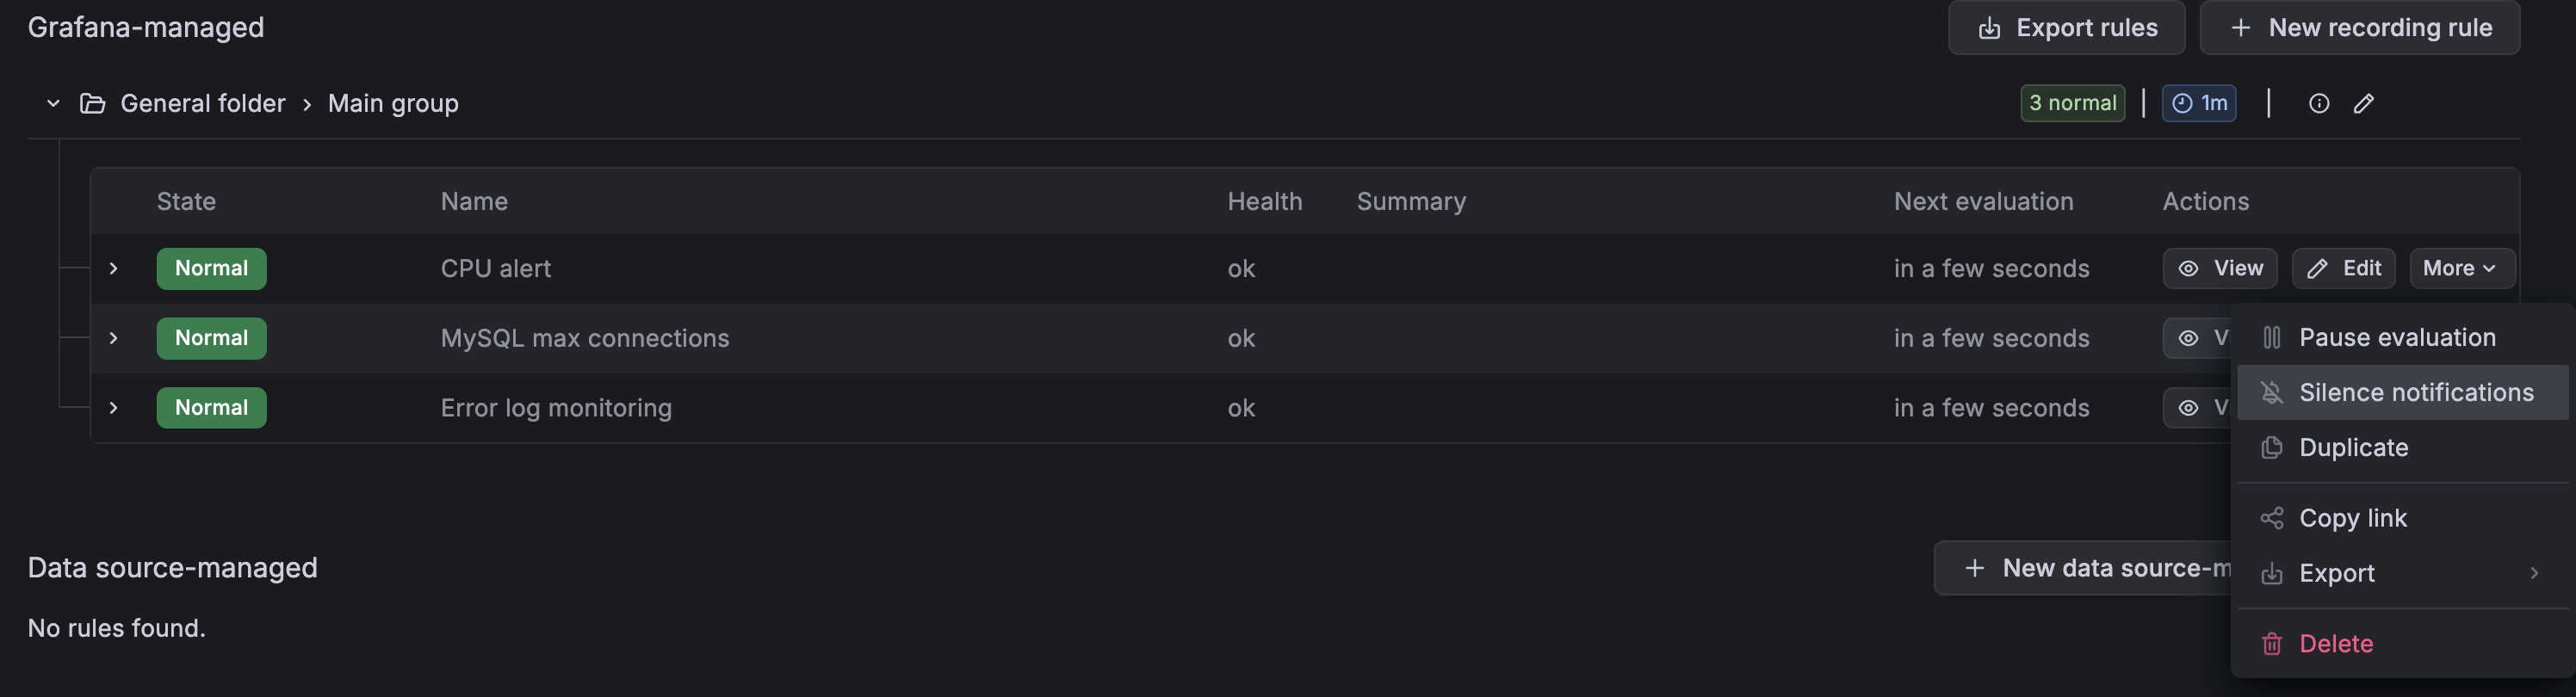
When you're doing planned maintenance and don't want to be spammed, you can silence any alert without deleting the rule. Go to Alerting → Alert rules, click the More button next to the rule you want to quiet, and select Silence Notifications. You can set a duration, add a comment for context, and Grafana will resume alerting automatically when the silence expires.
Wrapping Up
With alerting in place, the observability stack is no longer something you have to actively watch - it watches for you. Metric thresholds catch infrastructure problems before users notice, and log-based alerts surface application errors in real time.
This wraps up the full series: monitoring setup, MySQL metrics, distributed tracing, and now alerting. Each layer builds on the previous one and together they give a complete picture of what's happening in production.
Thank you for reading, and let's connect!