Requirements
Before we start, you need two things in place:
- A running MySQL instance - see MySQL Production Setup for how to get there.
- Alloy installed and configured - see Grafana Monitoring with OSS Tools for that setup.
Create a dedicated MySQL user for Alloy
It's good practice to give Alloy its own read-only monitoring user rather than reusing an application account. Log in to MySQL:
sudo mysql -u root -p
Then create the user and grant it the necessary permissions:
CREATE USER 'alloy_monitor'@'localhost' IDENTIFIED BY 'StrongPassword123!';
GRANT PROCESS, REPLICATION CLIENT, SELECT ON *.* TO 'alloy_monitor'@'localhost';
GRANT SELECT ON performance_schema.* TO 'alloy_monitor'@'localhost';
FLUSH PRIVILEGES;
Add MySQL configuration to Alloy
Open the Alloy config file: sudo nano /etc/alloy/config.alloy
Append the following at the end:
prometheus.exporter.mysql "mysql" {
  data_source_name = "alloy_monitor:StrongPassword123!@(127.0.0.1:3306)/"

  enable_collectors = [
    "global_status",
    "global_variables",
    "slave_status",
    "info_schema.innodb_metrics",
    "info_schema.processlist",
    "info_schema.tables",
    "perf_schema.eventsstatements",
    "perf_schema.file_instances",
    "perf_schema.memory_events",
  ]
}

prometheus.scrape "mysql" {
  targets    = prometheus.exporter.mysql.mysql.targets
  forward_to = [prometheus.remote_write.mimir.receiver]
  job_name   = "mysql"
}
After saving, restart Alloy for the changes to take effect:
sudo service alloy restart
Alloy is now shipping MySQL metrics to Mimir, ready to be visualized in Grafana.
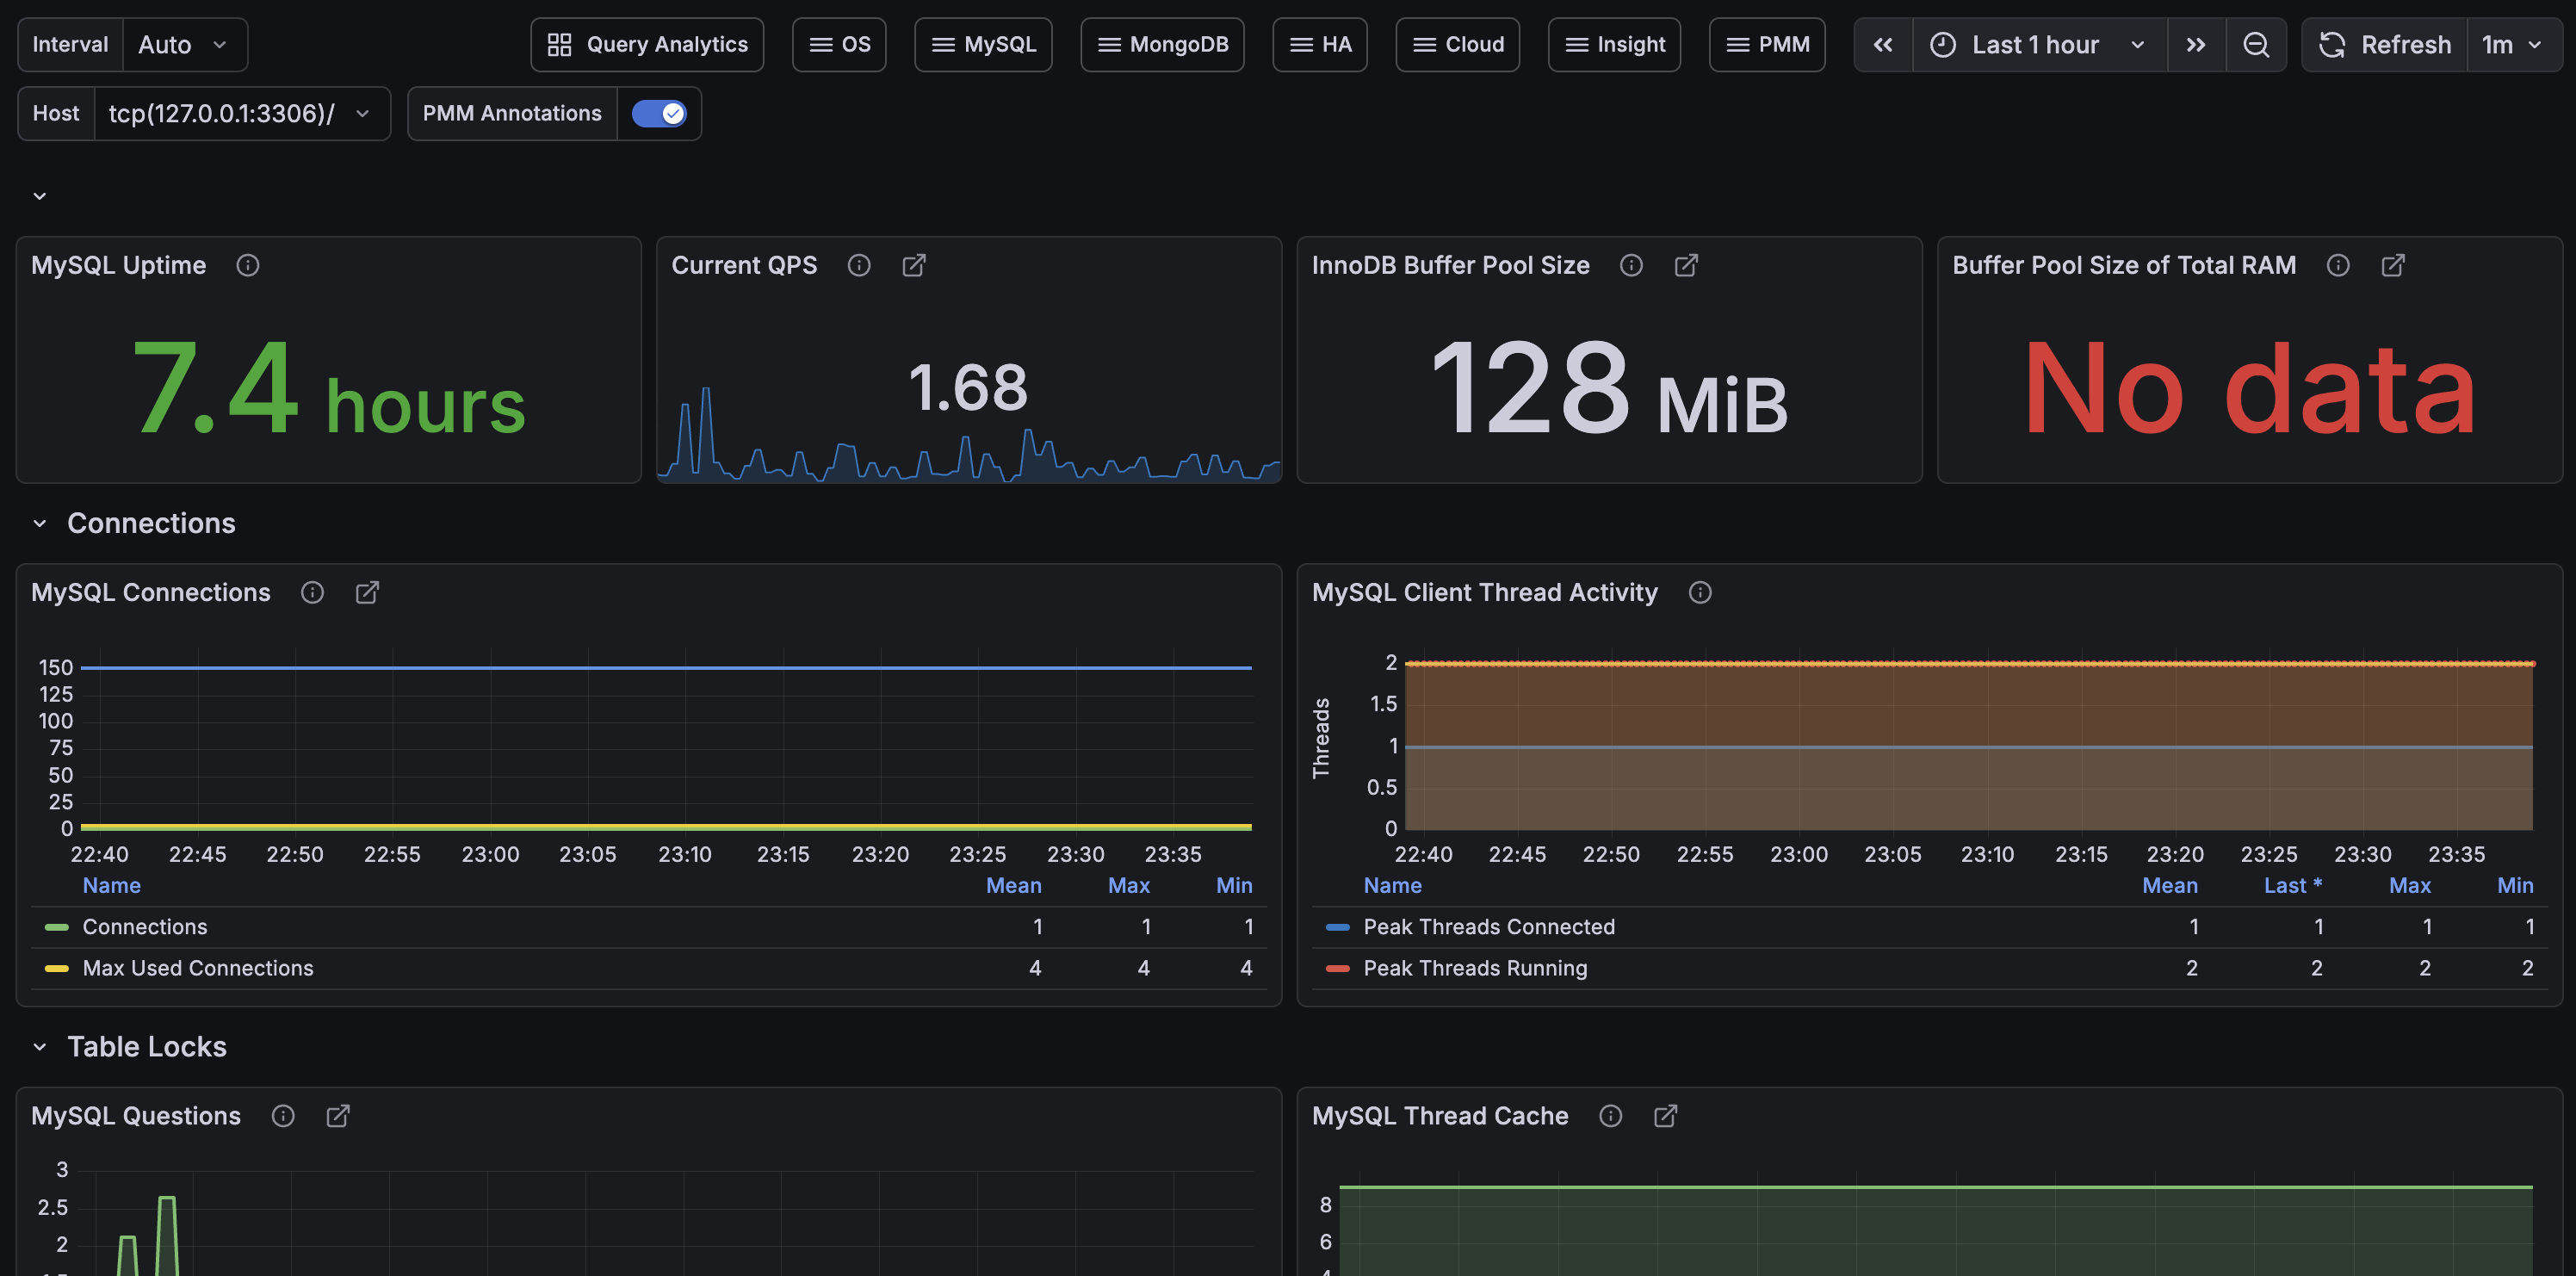
Grafana Dashboard
Rather than building a dashboard from scratch, you can import the official MySQL Overview dashboard directly from the Grafana dashboard library.
Wrapping Up
This guide builds on the two previous posts and gives you a working MySQL monitoring setup in just a few steps. From here, the natural next move is to set up some alerts so you get notified before small problems become big ones - Grafana Alerting for Your Production Stack walks through exactly that, including a ready-made MySQL max connections alert. If you want to go further and add distributed tracing to complete the full observability picture, check out Completing the LGTM Stack with Grafana Tempo.
Thank you for reading, and let's connect!